Table of Contents10 sections
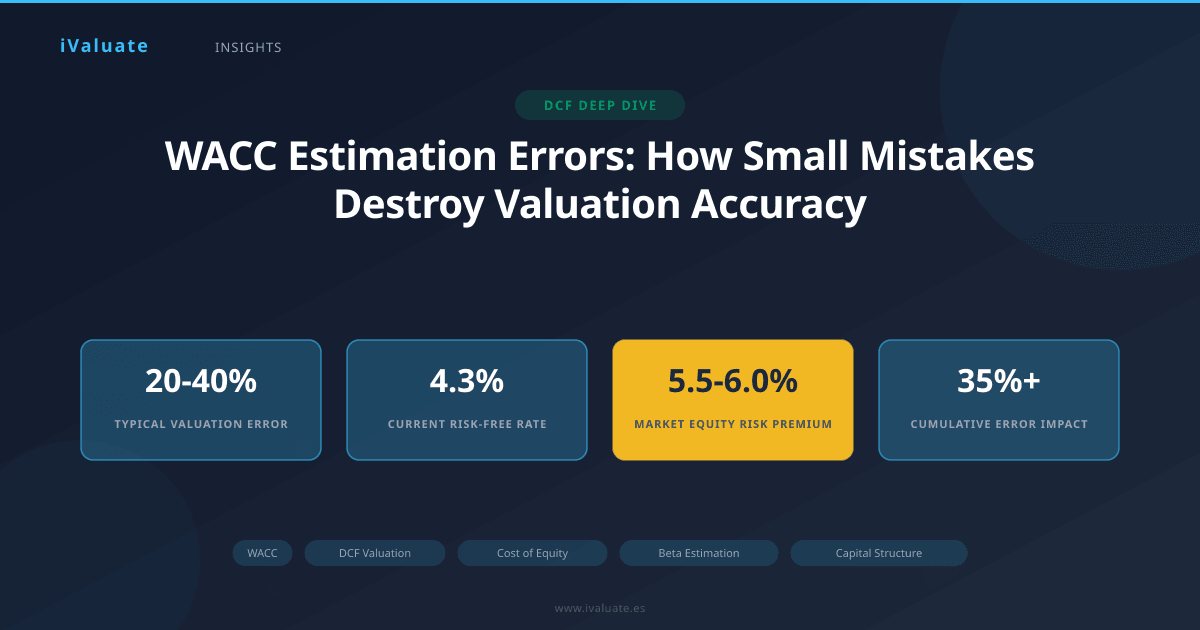
The Weighted Average Cost of Capital (WACC) stands as the linchpin of discounted cash flow (DCF) valuation, yet it remains one of the most frequently miscalculated metrics in corporate finance. A seemingly minor error in WACC estimation—whether in beta selection, capital structure assumptions, or cost of equity calculation—can cascade into valuation differences of 20% to 40% or more. In today's volatile market environment of 2025-2026, where risk-free rates have stabilized around 4.2-4.5% and equity risk premiums remain elevated, precision in WACC calculation has never been more critical.
This article examines the most common mistakes professionals make when estimating WACC, quantifies their impact on valuation outcomes, and provides a framework for avoiding these pitfalls in practice.
01 Understanding WACC: The Foundation of DCF Valuation
WACC represents the blended cost of capital a company pays to finance its operations, weighted by the proportion of debt and equity in its capital structure. The standard formula is:
WACC = (E/V × Re) + (D/V × Rd × (1-Tc))
Where E is market value of equity, D is market value of debt, V is total value (E+D), Re is cost of equity, Rd is cost of debt, and Tc is the corporate tax rate. While this formula appears straightforward, each component harbors potential for significant error.
The cost of equity (Re) is typically estimated using the Capital Asset Pricing Model (CAPM):
Re = Rf + β × (Rm - Rf)
Where Rf is the risk-free rate, β (beta) measures systematic risk, and (Rm - Rf) represents the equity risk premium. As of early 2026, with the 10-year Treasury yield at approximately 4.3% and equity risk premiums ranging from 5.5% to 6.5% depending on methodology, even small errors in beta estimation can materially impact the cost of equity.
02 Mistake #1: Using Book Values Instead of Market Values for Capital Structure
Perhaps the most fundamental error in WACC calculation is using book values rather than market values to determine capital structure weights. This mistake is surprisingly common, particularly among less experienced analysts who find book values readily available in financial statements.
Consider a technology company with $500 million in book equity and $200 million in book debt (a 71%/29% equity/debt split). However, the company's market capitalization stands at $2.5 billion while its debt trades at par. The market value capital structure is actually 93%/7% equity/debt—a dramatically different weighting that will significantly impact WACC.
Using book values in this scenario with a cost of equity of 11% and after-tax cost of debt of 3.5% yields:
WACC (book) = (0.71 × 11%) + (0.29 × 3.5%) = 8.8%
Using correct market values:
WACC (market) = (0.93 × 11%) + (0.07 × 3.5%) = 10.5%
This 1.7 percentage point difference translates to a valuation impact of approximately 18-22% for a company with moderate growth expectations. For a business generating $100 million in annual free cash flow growing at 3% perpetually, the book value error would overvalue the company by roughly $180 million.
Key Takeaway: Always use market values for capital structure weights. For private companies where market equity values aren't observable, use comparable public company capital structures or iterative valuation approaches.
03 Mistake #2: Inappropriate Beta Selection and Adjustment
Beta estimation represents one of the most nuanced aspects of WACC calculation, yet it's frequently handled with insufficient rigor. Common errors include using raw historical betas without adjustment, selecting inappropriate peer groups, and failing to account for leverage differences.
The Leverage Problem
Raw betas from data services like Bloomberg or Capital IQ reflect a company's current leverage. When valuing a company with a different target capital structure, analysts must unlever and relever beta appropriately. The formula for unlevered beta is:
βu = βL / [1 + (1-Tc) × (D/E)]
Where βu is unlevered beta, βL is levered (observed) beta, Tc is the tax rate, and D/E is the debt-to-equity ratio. Many analysts skip this step or apply it incorrectly.
In a recent mid-market manufacturing deal, the target company had minimal debt (D/E of 0.1) while the acquirer planned to implement a capital structure with D/E of 0.6. The observed beta of 1.15 needed to be unlevered to approximately 1.08, then relevered to 1.44 for the new capital structure. Failing to make this adjustment understated the cost of equity by roughly 200 basis points and overvalued the target by approximately $45 million on a $250 million transaction.
Peer Selection Bias
When estimating beta for private companies or divisions, analysts often select peer groups too broadly or narrowly. A common mistake is including companies with materially different business models, growth profiles, or geographic exposures. For instance, using a peer group that includes both pure-play software companies (typical betas of 1.3-1.6) and IT services firms (typical betas of 0.9-1.2) creates unnecessary noise.
Best practice involves selecting 5-10 true comparables, calculating unlevered betas for each, removing outliers, and using the median rather than mean to reduce the impact of extreme values. As of 2026, sector median betas show significant variation: technology (1.35), consumer staples (0.62), utilities (0.48), and financial services (1.18).
04 Mistake #3: Misestimating the Equity Risk Premium
The equity risk premium (ERP) represents the excess return investors demand for bearing equity risk over risk-free securities. Despite its critical importance, ERP estimation remains contentious, with practitioners using values ranging from 4.5% to 7.5% in current markets.
Three common approaches each have limitations:
- Historical averages: Using long-term historical returns (typically showing 5.5-6.5% premiums) assumes past relationships persist, which may not hold during structural market shifts
- Survey-based estimates: Academic and practitioner surveys (currently suggesting 5.8-6.2% premiums) reflect consensus views but can lag market changes
- Implied premiums: Backing out expected returns from current market prices and analyst forecasts (currently indicating 5.5-6.0% premiums) are forward-looking but sensitive to growth assumptions
The choice of ERP methodology can swing cost of equity estimates by 100-150 basis points. For a company with a beta of 1.2, the difference between a 5.0% ERP and a 6.5% ERP is 1.8 percentage points in cost of equity—enough to change valuation by 15-20%.
In 2025-2026, most sophisticated practitioners use a blended approach, weighting implied premiums (40-50%), historical averages (30-40%), and survey data (10-20%), resulting in ERPs of 5.5-6.0% for developed markets. However, many analysts simply default to a "standard" 6% without considering current market conditions, creating systematic bias.
05 Mistake #4: Incorrect Cost of Debt Estimation
While seemingly straightforward, cost of debt estimation harbors several common errors that can materially impact WACC, particularly for companies with significant leverage.
Using Coupon Rates Instead of Yield to Maturity
The cost of debt should reflect current market yields, not historical coupon rates. A company that issued bonds at 5% five years ago when rates were lower may see those bonds trading at a yield of 6.5% today. Using the 5% coupon rate understates the true cost of debt.
For companies with publicly traded debt, current yields provide the best estimate. For private companies, practitioners should reference credit spreads for comparable rated issuers. As of early 2026, typical credit spreads over Treasuries are: AAA (60-80 bps), AA (90-120 bps), A (130-170 bps), BBB (180-240 bps), BB (300-400 bps), and B (450-600 bps).
Ignoring the Tax Shield
Some analysts forget to tax-effect the cost of debt, overstating WACC. With corporate tax rates of 21% in the United States, the after-tax cost of 6% debt is 4.74%, not 6%. This seemingly small oversight compounds when debt represents 30-40% of capital structure, potentially overstating WACC by 40-60 basis points.
Mixing Marginal and Average Rates
WACC should reflect marginal costs—what the company would pay to raise additional capital today—not the average rate on existing debt. A company with legacy debt at 4% but current borrowing costs of 6.5% should use the higher marginal rate for valuation purposes.
Real-World Example: In a 2024 leveraged buyout of a specialty chemicals company, initial WACC estimates used the target's existing 4.5% average debt cost. However, the transaction required new debt financing at 7.2% (reflecting higher rates and increased leverage). Correcting this error increased WACC by 85 basis points and reduced the supportable purchase price by approximately $120 million on a $650 million deal.
06 Mistake #5: Capital Structure Inconsistencies
Maintaining consistency between capital structure assumptions and other valuation inputs proves surprisingly challenging in practice. Common inconsistencies include:
Terminal Value Mismatches
Analysts sometimes use one capital structure for the explicit forecast period and inadvertently assume a different structure in terminal value calculations. For instance, modeling debt paydown during the forecast period but calculating terminal value WACC using the initial capital structure creates an internal inconsistency.
Best practice requires explicitly modeling the expected steady-state capital structure and using that structure for terminal value WACC calculations. For mature companies, this typically means debt-to-total-capital ratios of 20-35%, depending on industry and cash flow stability.
Circular Reference Problems
WACC depends on market value of equity, but equity value is what we're solving for in a DCF. This circularity requires iterative solutions. Many analysts shortcut this by using book values or previous valuations, introducing error. Sophisticated models use Excel's circular reference capabilities or manual iteration to solve simultaneously for equity value and WACC.
Target vs. Actual Capital Structure
Should WACC reflect current capital structure or a target structure? For going concern valuations, using the company's stated target structure (if credible) makes sense. For transaction valuations, the post-transaction capital structure is appropriate. Using the wrong structure can materially impact results, particularly when current and target structures differ significantly.
07 Mistake #6: Ignoring Size and Company-Specific Risk Premiums
The basic CAPM framework assumes all unsystematic risk can be diversified away, but smaller companies and those with concentrated risks may require additional premiums. The debate over size premiums has intensified, with recent research questioning historical findings, but company-specific risk premiums remain relevant in certain contexts.
For companies with market capitalizations below $500 million, many practitioners add 1-3 percentage points to the cost of equity to reflect reduced liquidity, higher failure rates, and limited analyst coverage. However, this practice requires careful judgment—mechanically adding premiums without economic justification can systematically overstate discount rates and undervalue smaller businesses.
Company-specific premiums (typically 0.5-2.0 percentage points) may be warranted for:
- Key customer or supplier concentration exceeding 25-30% of revenues
- Pending litigation or regulatory matters with material potential impact
- Management transition or succession concerns
- Technological obsolescence risks not captured in cash flow projections
The critical principle: don't double-count risks already reflected in cash flow projections. If you've reduced forecast cash flows to account for customer concentration risk, don't also increase the discount rate for the same factor.
08 Quantifying the Cumulative Impact
Individual WACC errors compound to create substantial valuation distortions. Consider a mid-market company with $75 million in annual free cash flow, expected to grow at 4% perpetually. Let's trace how common mistakes accumulate:
Baseline (correct) assumptions:
- Risk-free rate: 4.3%
- Beta: 1.15 (properly unlevered and relevered)
- Equity risk premium: 5.8%
- Cost of equity: 11.0%
- After-tax cost of debt: 4.8%
- Market value capital structure: 75% equity / 25% debt
- WACC: 9.4%
- Enterprise value: $1,389 million
With common errors:
- Using book value capital structure (60% equity / 40% debt): WACC = 8.5%
- Using raw beta without relevering (1.05): Cost of equity = 10.4%
- Using 6.5% ERP without justification: Cost of equity = 11.8%
- Using coupon rate instead of market yield for debt: After-tax cost = 3.9%
- Combined erroneous WACC: 7.8%
- Resulting enterprise value: $1,875 million
The cumulative effect of these common mistakes overvalues the company by $486 million—a 35% error. In a competitive M&A process, this magnitude of error could mean the difference between winning and losing a deal, or worse, winning at an unsustainable price.
09 Best Practices for WACC Estimation in 2026
Professional-grade WACC estimation requires systematic rigor and documentation. Leading practitioners follow these protocols:
1. Build Transparent Models
Create separate calculation schedules for each WACC component with clear documentation of sources and assumptions. This transparency facilitates review and enables sensitivity analysis around key drivers.
2. Perform Sensitivity Analysis
Given inherent estimation uncertainty, always present WACC as a range (e.g., 8.5-10.5%) rather than a false-precision point estimate. Show how valuation changes across reasonable WACC scenarios. Most sophisticated analyses present results in a matrix showing sensitivity to both WACC and terminal growth rate assumptions.
3. Triangulate with Market Evidence
Compare implied returns from your WACC estimate against observable market data. If your WACC suggests equity returns materially different from what comparable public companies have delivered, investigate the disconnect. Recent transaction multiples can also provide reality checks—if your DCF yields an EV/EBITDA multiple far from market norms, scrutinize your WACC assumptions.
4. Update Regularly
WACC inputs change with market conditions. Risk-free rates, credit spreads, and equity risk premiums all fluctuate. What was appropriate in 2023 when the 10-year Treasury yielded 3.8% requires updating now that it yields 4.3%. Establish quarterly review protocols for WACC assumptions, particularly for portfolio companies or ongoing valuations.
5. Document Peer Selection Rigorously
Maintain detailed documentation of peer company selection criteria, including why specific companies were included or excluded. This discipline prevents unconscious bias toward peers that support desired conclusions and creates defensible audit trails for fairness opinions and litigation contexts.
6. Separate Business Risk from Financial Risk
Properly unlever and relever betas to isolate business risk from capital structure effects. This separation enables more accurate comparisons across companies with different leverage policies and ensures consistency between capital structure assumptions and risk measures.
10 The Path Forward: Technology-Enabled Precision
As markets become more complex and stakeholders demand greater valuation transparency, the tolerance for WACC estimation errors continues to shrink. Regulatory scrutiny of fairness opinions, litigation over purchase price disputes, and sophisticated investors' ability to detect valuation inconsistencies all raise the stakes for precision.
Modern valuation platforms have emerged to address these challenges. Tools like iValuate incorporate real-time market data feeds for risk-free rates and credit spreads, maintain curated peer group databases with automatically updated betas, and enforce consistency between capital structure assumptions and other valuation inputs. These platforms reduce mechanical errors while allowing professionals to focus judgment on genuinely subjective elements like company-specific risk premiums and strategic considerations.
The evolution toward more systematic WACC estimation doesn't eliminate professional judgment—it elevates it. Rather than spending time manually gathering Treasury yields or calculating unlevered betas, professionals can focus on the truly difficult questions: Is this peer group truly comparable? Does this company face risks not captured in standard beta estimates? How will capital structure evolve over time?
In the current market environment of 2025-2026, characterized by elevated interest rates, persistent inflation concerns, and geopolitical uncertainty, WACC estimation errors carry particularly severe consequences. The difference between a 9% and 11% WACC—easily achievable through the common mistakes outlined above—translates to valuation swings of 20-25% for typical growth companies. For a $500 million transaction, that's $100-125 million at stake.
Professional valuation practitioners must treat WACC estimation with the rigor it demands. By understanding common pitfalls, implementing systematic estimation protocols, and leveraging technology to reduce mechanical errors, analysts can deliver the precision that today's high-stakes transactions require. The companies and investors who master these details will consistently make better capital allocation decisions, while those who treat WACC as a back-of-the-envelope calculation will continue to destroy value through systematic bias.
As valuation continues to evolve from art toward science, the professionals who combine deep theoretical understanding with practical implementation discipline—supported by platforms like iValuate that automate routine calculations while preserving professional judgment—will define best practice for the next generation of corporate finance.