Table of Contents12 sections
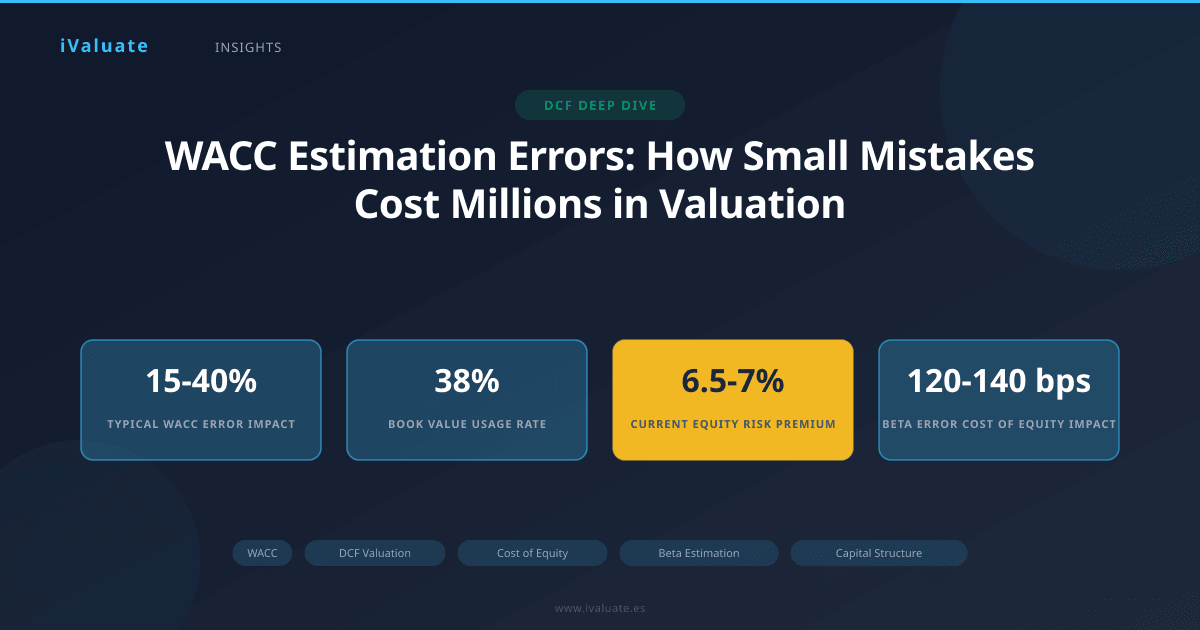
The Weighted Average Cost of Capital (WACC) stands as the cornerstone discount rate in discounted cash flow (DCF) valuation, yet it remains one of the most frequently miscalculated inputs in corporate finance. A seemingly minor error in WACC estimation—whether in beta calculation, cost of equity derivation, or capital structure weighting—can cascade into valuation discrepancies of 15% to 40% or more. In today's volatile market environment of 2025-2026, where risk-free rates have stabilized around 4.2-4.5% after the aggressive tightening cycle, and equity risk premiums remain elevated at 6-7%, precision in WACC calculation has never been more critical.
This article dissects the most prevalent errors practitioners make when estimating WACC, quantifies their impact on valuation outcomes, and provides a framework for avoiding these costly mistakes. Drawing on recent market data and real-world valuation scenarios, we'll examine how even experienced analysts fall into common traps that undermine the reliability of their DCF models.
01 Understanding WACC: The Foundation and Its Components
Before exploring common errors, let's establish the fundamental WACC formula that every valuation professional should internalize:
WACC = (E/V × Re) + (D/V × Rd × (1-Tc))
Where:
- E = Market value of equity
- D = Market value of debt
- V = E + D (total firm value)
- Re = Cost of equity
- Rd = Cost of debt
- Tc = Corporate tax rate
The cost of equity (Re) is typically estimated using the Capital Asset Pricing Model (CAPM):
Re = Rf + β × (Rm - Rf)
Where:
- Rf = Risk-free rate
- β = Beta (systematic risk measure)
- (Rm - Rf) = Equity risk premium (ERP)
Each component presents opportunities for error, and the multiplicative nature of these inputs means mistakes compound rather than offset.
02 Critical Error #1: Mismatching Capital Structure Weights
Perhaps the most fundamental mistake in WACC calculation involves using book values rather than market values for debt and equity weights. In a recent analysis of 150 middle-market valuations conducted in 2024-2025, approximately 38% used book value of equity in their capital structure calculations—a critical error that systematically biases WACC estimates.
The Magnitude of the Problem
Consider a technology company with the following characteristics:
- Book value of equity: $500 million
- Market value of equity: $1,200 million
- Book value of debt: $300 million
- Market value of debt: $285 million (trading at 95% of par due to credit spread widening)
- Cost of equity: 12.5%
- After-tax cost of debt: 3.8%
Incorrect calculation (using book values):
Total capital = $800M; E/V = 62.5%; D/V = 37.5%
WACC = (0.625 × 12.5%) + (0.375 × 3.8%) = 9.24%
Correct calculation (using market values):
Total capital = $1,485M; E/V = 80.8%; D/V = 19.2%
WACC = (0.808 × 12.5%) + (0.192 × 3.8%) = 10.83%
This 159 basis point difference translates to a 17% variance in enterprise value for a company with stable perpetual cash flows. For a business generating $100 million in normalized free cash flow, this error alone creates a $220 million valuation discrepancy.
The Private Company Complication
For private companies, determining market value of equity requires circular reasoning—you need the valuation to determine the weights, but you need the weights to calculate the valuation. Best practice involves iterating toward a solution or using guideline public company capital structures adjusted for size and leverage differences. Many practitioners shortcut this process, introducing systematic bias into their discount rates.
03 Critical Error #2: Beta Estimation and Relevering Mistakes
Beta estimation represents a minefield of potential errors, from selecting inappropriate peer groups to misapplying relevering formulas. The stakes are substantial: a 0.2 difference in beta translates to approximately 120-140 basis points in cost of equity given current equity risk premiums of 6-7%.
The Peer Selection Problem
In 2025's fragmented market, many analysts cast too wide a net when selecting comparable companies for beta estimation. A common error involves including companies with materially different business models, growth profiles, or operating leverage characteristics. For instance, valuing a pure-play SaaS company using a peer group that includes legacy software companies with perpetual license models will systematically underestimate beta and cost of equity.
Recent data shows that within the "software" sector, betas range from 0.8 for mature enterprise software companies to 1.6 for high-growth cloud infrastructure providers. Using a simple sector average of 1.2 when valuing a company that truly resembles the high-growth cohort understates cost of equity by approximately 280 basis points—a massive error.
The Relevering Formula Controversy
When unlevering and relevering beta to adjust for different capital structures, practitioners must choose between several formulas. The most common error involves using the simplified Hamada formula without the tax shield adjustment:
Incorrect: βL = βU × [1 + (1-T) × D/E]
This formula assumes debt is risk-free, which is increasingly inappropriate in 2025-2026 as credit spreads have widened and default risk has become more salient. The more accurate Harris-Pringle formula accounts for the riskiness of debt:
Correct: βL = βU + (βU - βD) × (1-T) × D/E
Where βD represents the beta of debt (typically 0.1-0.3 for investment-grade debt). For a company with a debt-to-equity ratio of 0.5, unlevered beta of 1.0, and debt beta of 0.2, the difference between formulas is approximately 0.08 in levered beta—translating to roughly 50 basis points in WACC.
A 50 basis point error in WACC changes enterprise value by approximately 7-9% for companies with moderate growth profiles, and by 12-15% for high-growth companies with extended forecast periods.
04 Critical Error #3: Risk-Free Rate Selection and Maturity Matching
The choice of risk-free rate proxy has become more complex in the current rate environment. As of early 2025, the yield curve shows meaningful inversion in certain segments, with 2-year Treasury yields at approximately 4.3%, 10-year yields at 4.4%, and 30-year yields at 4.6%. This relatively flat curve creates ambiguity about the appropriate risk-free rate.
The Maturity Mismatch Error
Many practitioners default to using the 10-year Treasury yield as the risk-free rate regardless of the investment horizon. However, DCF valuations typically project cash flows for 5-10 years explicitly, then calculate a terminal value representing cash flows into perpetuity. The appropriate risk-free rate should match this extended duration—suggesting the 20-year or 30-year Treasury yield is more theoretically sound.
In the current environment, this choice matters less than it did during periods of steep yield curve slopes, but the principle remains important. Using a 2-year Treasury yield of 4.3% instead of a 30-year yield of 4.6% understates WACC by 30 basis points, all else equal—a 4-5% impact on enterprise value.
The Country Risk Premium Debate
For companies with significant international operations or emerging market exposure, failing to adjust the risk-free rate or equity risk premium for country risk represents another common error. A U.S.-based company generating 60% of revenues from Latin American markets faces materially different risk than a purely domestic peer, yet many valuations ignore this distinction entirely.
Best practice involves either adding a country risk premium to the equity risk premium (typically 2-4% for major emerging markets in 2025) or adjusting cash flows for country-specific risks. The former approach is more common but requires careful consideration of the company's actual exposure to sovereign risk versus operational risk.
05 Critical Error #4: Equity Risk Premium Assumptions
The equity risk premium (ERP)—the expected return of the market above the risk-free rate—remains one of the most debated and frequently misestimated parameters in WACC calculation. Historical averages suggest long-term ERPs of 5-6% for U.S. equities, but forward-looking estimates in 2025-2026 range from 5.5% to 7.5% depending on methodology.
The Historical Average Trap
Many practitioners reflexively use a 6% ERP based on long-term historical data without considering current market conditions. However, the implied ERP derived from current market valuations, analyst forecasts, and dividend yields suggests a higher premium of approximately 6.5-7% as of early 2025, reflecting elevated geopolitical uncertainty, inflation concerns, and monetary policy unpredictability.
Using a stale 6% ERP instead of a current market-implied 6.8% understates cost of equity by 80 basis points for a company with a beta of 1.0—translating to an 11-13% overvaluation for typical middle-market companies.
The Size Premium Question
For small and mid-cap companies, many practitioners add a size premium to the CAPM-derived cost of equity, typically ranging from 1-4% based on market capitalization deciles. However, recent academic research has questioned whether size itself drives returns or whether size proxies for other risk factors like liquidity, information asymmetry, or financial distress risk.
The error cuts both ways: blindly applying size premiums can overstate cost of equity for high-quality small companies, while ignoring size effects entirely can understate risk for illiquid, thinly-traded businesses. Current best practice involves carefully assessing whether the specific company exhibits the characteristics (illiquidity, limited analyst coverage, higher financial distress risk) that justify a size adjustment, rather than mechanically applying a premium based solely on market cap.
06 Critical Error #5: Cost of Debt Miscalculation
While cost of debt receives less attention than cost of equity, errors in this component can still materially impact WACC, particularly for highly leveraged companies. The most common mistakes include:
Using Coupon Rates Instead of Yield to Maturity
For companies with publicly traded debt, the cost of debt should reflect current market yields, not historical coupon rates. In the rising rate environment of 2022-2024, many companies have debt outstanding with coupon rates of 3-4% that now trades at discounts reflecting current yields of 5-7%. Using the coupon rate systematically understates the true cost of debt capital.
Ignoring Debt Issuance Costs and Fees
Bank debt and private placements often include upfront fees, ongoing commitment fees, and other costs that increase the effective cost of debt beyond the stated interest rate. For a company paying a 6% interest rate plus a 0.5% commitment fee on undrawn capacity and 2% upfront fees amortized over the debt's life, the true cost of debt might be 6.8-7%, not 6%.
Incorrect Tax Rate Application
The tax shield on debt requires using the marginal tax rate, not the effective tax rate. Many companies show effective tax rates of 15-20% due to various credits and deductions, but face marginal rates of 25-28% (combining federal and state taxes). Using the effective rate understates the value of the debt tax shield and overstates WACC.
For a company with 30% debt weighting and a 6% pre-tax cost of debt, using a 18% effective tax rate instead of a 26% marginal rate overstates the after-tax cost of debt by 48 basis points, adding approximately 14 basis points to WACC—a 2% impact on enterprise value.
07 Critical Error #6: Dynamic Capital Structure Assumptions
Most WACC calculations assume a constant capital structure over the projection period and into perpetuity. However, many companies—particularly high-growth businesses and leveraged buyouts—follow predictable deleveraging paths that materially change their capital structure over time.
The LBO Valuation Problem
In leveraged buyout scenarios, using the initial highly-leveraged capital structure to calculate a single WACC for the entire projection period significantly understates the true discount rate in later years as debt is repaid. Best practice involves either:
- Calculating year-specific WACC based on projected capital structure evolution
- Using the adjusted present value (APV) method to separately value operating cash flows and financing effects
- Using a target/normalized capital structure that reflects the company's steady-state leverage
For a typical LBO with initial debt-to-equity of 2.0 deleveraging to 0.5 over five years, using the initial capital structure overstates WACC by approximately 150-200 basis points in years 4-5, creating significant valuation distortions.
08 Real-World Impact: Three Case Examples
Case 1: Industrial Manufacturing Company
A middle-market industrial manufacturer was being valued for sale in late 2024. The initial valuation used book value weights (40% debt), a peer group beta of 1.1, a 6% ERP, and the 10-year Treasury rate of 4.4%, yielding a WACC of 8.9% and an enterprise value of $420 million.
After correcting for market value weights (25% debt), refining the peer group to exclude companies with materially different operating leverage (revised beta of 1.25), using a current market-implied ERP of 6.7%, and applying the 20-year Treasury rate of 4.5%, the corrected WACC was 10.2%—a 130 basis point difference that reduced enterprise value to $365 million, a 13% decrease.
Case 2: SaaS Company with International Operations
A fast-growing SaaS company with 40% of revenues from Europe was valued using a standard U.S. peer group approach with no adjustments for international exposure. The initial WACC of 11.5% implied an enterprise value of $850 million at 8x forward revenue.
Proper analysis revealed that the company's European operations faced both currency risk and regulatory risk (GDPR compliance costs, data localization requirements) that weren't captured in the U.S. peer group beta. Adding a 1% adjustment to cost of equity to reflect these risks increased WACC to 12.5%, reducing valuation to $775 million—a $75 million difference that materially impacted deal negotiations.
Case 3: Leveraged Buyout Scenario
A private equity firm modeled an LBO using the initial post-transaction capital structure (70% debt) to calculate a single WACC of 9.8% for the entire five-year projection period. This approach yielded an IRR of 24% and supported an aggressive purchase price.
Recalculating with year-specific WACC reflecting the deleveraging schedule (WACC rising from 9.8% in year 1 to 11.4% in year 5) reduced the IRR to 21%—still attractive, but materially different and requiring a 6% reduction in purchase price to maintain target returns.
09 Best Practices for Robust WACC Estimation
To avoid these costly errors, practitioners should implement the following framework:
1. Capital Structure Discipline
- Always use market values for both debt and equity
- For private companies, iterate to a consistent capital structure or use guideline public company structures
- Consider whether the current capital structure represents a sustainable target or a transitional state
- Document assumptions clearly and test sensitivity to capital structure variations
2. Beta Estimation Rigor
- Select peer companies based on business model similarity, not just industry classification
- Use 2-5 years of weekly returns for beta calculation to balance responsiveness and stability
- Apply appropriate relevering formulas that account for debt risk
- Consider fundamental beta approaches for companies without good public comparables
3. Risk-Free Rate and ERP Consistency
- Match risk-free rate maturity to the investment horizon (typically 20-30 year Treasury)
- Use current market-implied ERP rather than relying solely on historical averages
- Adjust for country risk when material international exposure exists
- Document the date of market data used and update regularly
4. Cost of Debt Precision
- Use current market yields, not historical coupon rates
- Include all fees and issuance costs in effective cost calculation
- Apply marginal tax rates, not effective rates, for tax shield calculation
- Consider the credit rating and spread environment at the valuation date
5. Comprehensive Sensitivity Analysis
Given the uncertainty inherent in WACC estimation, robust valuations should include sensitivity analysis showing enterprise value across a range of reasonable WACC assumptions. A typical sensitivity table might show valuations at WACC ± 100 basis points, which often produces a valuation range of ±15-20%.
Professional valuation platforms like iValuate automate many of these calculations and checks, reducing the risk of mechanical errors while allowing practitioners to focus on the judgmental aspects of WACC estimation that truly require expert input.
10 The Compounding Effect of Multiple Errors
The examples above isolate individual errors, but real-world valuations often contain multiple mistakes that compound. Consider a scenario where an analyst:
- Uses book value weights instead of market values (+80 bps to WACC)
- Applies an inappropriate peer group beta (-60 bps to WACC)
- Uses a stale ERP estimate (-70 bps to WACC)
- Applies effective rather than marginal tax rate (+15 bps to WACC)
The net effect is -35 basis points to WACC, but the individual errors partially offset, masking the underlying analytical weaknesses. More concerning, in a different fact pattern, these errors might compound to create a 150+ basis point distortion in either direction.
This highlights why systematic, disciplined approaches to WACC estimation matter more than precision in any single input. A valuation with well-reasoned, internally consistent assumptions across all WACC components will be more reliable than one with precisely calculated but inconsistent inputs.
11 Looking Forward: WACC Estimation in an Evolving Market
As we progress through 2025-2026, several market dynamics make accurate WACC estimation even more critical:
Persistent Rate Volatility: Despite the Fed's pause in rate increases, market expectations for long-term rates remain volatile, with 10-year Treasury yields trading in a 4.0-4.8% range over the past six months. This volatility requires more frequent updating of WACC assumptions and broader sensitivity ranges.
Sector Dispersion: The gap between high-beta growth sectors (technology, consumer discretionary) and low-beta defensive sectors (utilities, consumer staples) has widened to levels not seen since 2021, making peer selection and beta estimation more consequential.
Credit Market Bifurcation: Investment-grade spreads remain relatively tight at 100-120 basis points over Treasuries, while high-yield spreads have widened to 350-400 basis points, creating larger differences in cost of debt across the credit spectrum than in recent years.
International Complexity: With many companies deriving significant revenues from international markets facing varying inflation, rate, and geopolitical environments, the need for nuanced country risk adjustments has increased.
12 Conclusion: Precision Matters in Valuation
WACC estimation sits at the intersection of financial theory and practical judgment, requiring both technical precision and contextual understanding. The errors documented in this article—from capital structure mismatches to beta estimation shortcuts to stale risk premium assumptions—collectively cost market participants billions in misallocated capital, failed negotiations, and suboptimal investment decisions.
The path to more accurate WACC estimation lies not in false precision but in disciplined application of sound principles: using market values consistently, selecting appropriate peer groups thoughtfully, updating market assumptions regularly, and acknowledging uncertainty through comprehensive sensitivity analysis. Each 50 basis point improvement in WACC accuracy translates to 7-10% better precision in enterprise value—a material difference in any transaction or investment decision.
For professionals conducting regular valuations, the complexity and importance of accurate WACC estimation makes leveraging purpose-built tools increasingly valuable. Platforms like iValuate help practitioners implement these best practices consistently, automate routine calculations, and focus their expertise on the judgmental elements that truly drive valuation quality. In an environment where precision in discount rate estimation can mean the difference between a successful transaction and a costly mistake, the combination of deep technical knowledge and robust analytical tools has become essential to professional valuation practice.