Table of Contents8 sections
The financial services sector represents one of the most complex and nuanced arenas for mergers and acquisitions. Unlike industrial companies where enterprise value-to-EBITDA multiples dominate, financial institutions require fundamentally different valuation frameworks that account for regulatory capital requirements, balance sheet composition, and the unique economics of intermediation. As we navigate through 2025 and into 2026, the convergence of traditional banking, insurance, and fintech has created unprecedented valuation challenges for M&A professionals.
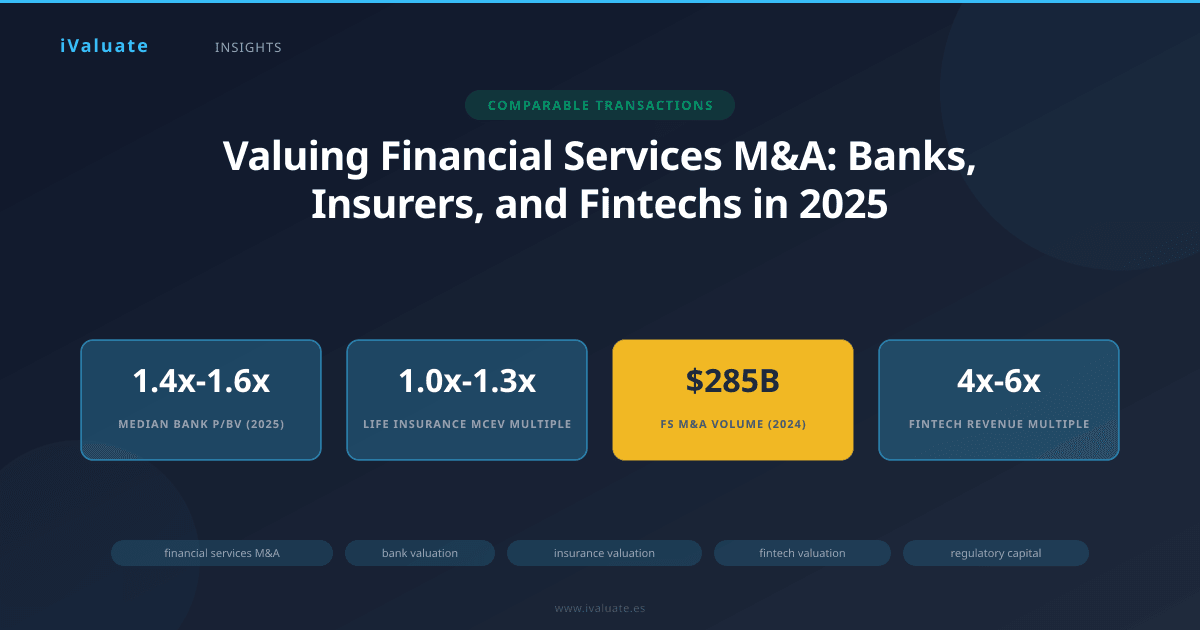
The global financial services M&A market has demonstrated remarkable resilience, with transaction volumes reaching approximately $285 billion in 2024, representing a 22% increase from the prior year. This resurgence follows a period of regulatory digestion and balance sheet repair post-pandemic. However, the valuation methodologies applied across banking, insurance, and fintech transactions differ substantially, requiring practitioners to master multiple frameworks simultaneously.
01 The Primacy of Price-to-Book Value in Banking M&A
For traditional banks and credit institutions, price-to-book value (P/BV) remains the dominant valuation metric, and for good reason. Unlike operating companies where book value may bear little relationship to economic value, a bank's book value—specifically its tangible common equity—represents the regulatory capital buffer that supports its lending activities and absorbs losses. This makes P/BV not merely a valuation multiple but a direct measure of how the market values a bank's franchise relative to its regulatory capital base.
In the current market environment, median P/BV multiples for U.S. regional bank acquisitions have stabilized around 1.4x to 1.6x tangible book value, a notable recovery from the 1.1x to 1.3x range observed during the regional banking crisis of early 2023. European bank transactions typically trade at a discount, with median multiples ranging from 0.9x to 1.2x, reflecting persistent concerns about profitability in negative or low-rate environments, though this gap has narrowed as European Central Bank policy has normalized.
Adjusting Book Value for Valuation Purposes
Sophisticated acquirers never accept reported book value at face value. Several critical adjustments are standard practice in banking M&A:
- Mark-to-market adjustments on securities portfolios: Held-to-maturity securities carried at amortized cost may have significant unrealized losses, particularly for banks that loaded up on long-duration securities before the 2022-2023 rate increases. These adjustments can reduce tangible book value by 10-20% in extreme cases.
- Loan loss reserve adequacy: Acquirers typically conduct granular credit reviews and often mark up reserves by 50-100 basis points of gross loans, particularly for commercial real estate and leveraged lending portfolios.
- Core deposit intangibles: While not reflected in book value, the present value of below-market funding from core deposits represents substantial economic value, often worth 3-5% of core deposits depending on rate environment and deposit beta assumptions.
- Deferred tax asset realization: DTAs must be evaluated for realizability under combined entity projections, with haircuts applied where realization is uncertain.
Consider the hypothetical acquisition of a $15 billion asset regional bank with reported tangible book value of $1.8 billion. After adjusting for $180 million in unrealized securities losses, $75 million in additional loan loss reserves, and $45 million in other asset marks, adjusted tangible book value falls to $1.5 billion. At a 1.5x multiple, the implied transaction value would be $2.25 billion—but the acquirer is actually paying 1.8x reported book value, a critical distinction for deal communication and fairness opinions.
Earnings Multiples as Secondary Validation
While P/BV drives pricing, price-to-earnings multiples serve as important validation metrics. Banking transactions in 2025 have typically priced at 12x to 16x forward earnings for well-performing franchises, with considerable variation based on asset quality, deposit franchise strength, and earnings sustainability. The P/E multiple becomes particularly important when evaluating banks trading below tangible book value, where the earnings power may justify a premium to book despite balance sheet concerns.
The relationship between P/BV and P/E multiples is mediated by return on equity (ROE). A bank earning a 15% ROE trading at 1.5x book value implies a P/E of 10x (1.5 ÷ 0.15), while a bank earning 10% ROE at the same P/BV multiple implies a 15x P/E. This mathematical relationship provides a useful sanity check: banks trading at high P/BV multiples relative to their ROE may be overvalued unless sustainable ROE improvement is credible.
02 Insurance M&A: The Embedded Value Framework
Insurance company valuation diverges sharply from banking, with embedded value (EV) serving as the foundation for life insurance and annuity writers, while property & casualty insurers are typically valued using a hybrid of P/BV and earnings multiples. The complexity stems from the long-duration nature of insurance liabilities and the need to value future profit streams from in-force business.
Understanding Embedded Value
Embedded value represents the present value of future distributable profits from in-force business, plus the adjusted net asset value of the company. The European Insurance CFO Forum has standardized the Market Consistent Embedded Value (MCEV) methodology, which has become the global standard for life insurance transactions. MCEV consists of three components:
- Adjusted net worth: The market value of assets backing required capital, adjusted for any non-economic items in statutory or GAAP equity.
- Value of in-force business (VIF): The present value of future statutory profits from existing policies, discounted at rates reflecting the illiquidity premium and risk characteristics of the cash flows.
- Cost of required capital: A deduction reflecting the frictional costs of holding regulatory capital that could otherwise be deployed elsewhere.
In recent transactions, life insurance acquisitions have typically priced at 1.0x to 1.3x MCEV for traditional life and annuity businesses, with significant premiums for businesses with strong distribution capabilities or proprietary product advantages. The acquisition of a mid-sized U.S. life insurer in late 2024 priced at 1.15x MCEV, reflecting the target's strong variable annuity franchise and efficient capital structure.
P&C Insurance: A Different Calculus
Property and casualty insurers are typically valued using a combination of P/BV multiples (ranging from 1.2x to 2.0x for well-performing franchises) and earnings multiples based on underwriting income plus investment income. The key driver is the combined ratio—the sum of loss ratio and expense ratio. Insurers consistently achieving combined ratios below 95% command premium valuations, as they generate underwriting profits in addition to investment returns on float.
The hard market conditions prevailing through 2024-2025, characterized by rate increases of 5-15% across most commercial lines, have driven P&C valuations to the higher end of historical ranges. Specialty insurers with underwriting discipline and favorable loss development have traded at 1.8x to 2.2x book value in recent transactions, reflecting both current profitability and the embedded value of rate increases still earning through the book.
A critical consideration in insurance M&A is the treatment of accumulated other comprehensive income (AOCI), particularly unrealized gains or losses on fixed-income portfolios. With the bond market volatility of 2022-2023 now largely reversed, many insurers have seen AOCI swing from significantly negative to neutral or positive, directly impacting book value and P/BV multiples.
03 Regulatory Capital: The Binding Constraint
Regulatory capital requirements fundamentally shape financial services valuation in ways that have no parallel in other industries. For banks, the Common Equity Tier 1 (CET1) ratio under Basel III standards determines lending capacity and dividend sustainability. For insurers, risk-based capital (RBC) ratios under Solvency II (Europe) or state-level RBC requirements (U.S.) constrain growth and capital deployment.
Capital Requirements and Valuation Multiples
The relationship between regulatory capital and valuation multiples is direct and quantifiable. Consider two banks, each with $10 billion in risk-weighted assets. Bank A maintains a 10% CET1 ratio ($1 billion in capital), while Bank B operates at 12% ($1.2 billion). If both banks earn identical returns on risk-weighted assets, Bank A will generate higher ROE due to its lower capital base—and will typically command a higher P/BV multiple, all else equal.
However, "all else" is rarely equal. The bank with lower capital ratios faces greater regulatory scrutiny, reduced flexibility for capital deployment, and higher risk of enforcement actions during stress periods. The optimal capital structure balances ROE maximization against franchise risk, with most acquirers targeting post-acquisition CET1 ratios of 10-11% for regional banks and 11-12% for larger institutions with GSIB surcharges.
Capital Accretion and Earnback Periods
Every financial services acquisition must be evaluated for its impact on the acquirer's regulatory capital ratios. The earnback period—the time required for the acquisition to restore the acquirer's capital ratio to pre-transaction levels through retained earnings—is a critical deal metric. Transactions with earnback periods exceeding three years face heightened scrutiny from boards and regulators.
The capital impact calculation requires careful modeling of goodwill and other intangibles created in the transaction. Under U.S. regulatory capital rules, goodwill and most intangibles are deducted from CET1 capital, creating an immediate capital hit. A $2 billion acquisition at 1.5x tangible book value ($1.5 billion in tangible equity) creates $500 million in goodwill, which must be deducted from the acquirer's CET1 capital. If the acquirer has $10 billion in pre-transaction CET1 capital and $100 billion in risk-weighted assets (10% ratio), the acquisition would reduce the CET1 ratio to 9.5%, assuming no change in risk-weighted assets—a material impact requiring careful management.
04 Fintech Valuation: Bridging Two Worlds
The explosive growth of fintech has created a valuation challenge that sits at the intersection of financial services and technology. Should a digital payments platform be valued like a bank (P/BV multiples) or like a SaaS company (revenue multiples)? The answer depends on the business model, regulatory status, and path to profitability.
The Fintech Valuation Spectrum
Fintech companies span a wide spectrum of business models, each requiring different valuation approaches:
- Digital banks and neobanks: These are fundamentally banks with technology-enabled distribution. Once profitability is established, they trade at P/BV multiples similar to traditional banks, though often at premiums reflecting superior unit economics and growth potential. Recent transactions have priced profitable neobanks at 2.0x to 3.0x tangible book value.
- Payments processors and networks: Valued primarily on revenue multiples (3x to 8x revenue depending on growth and margins) and EBITDA multiples (15x to 25x), similar to technology infrastructure companies. The key driver is take rate sustainability and the defensibility of network effects.
- Lending platforms: These require hybrid approaches. The loan portfolio is valued like a bank portfolio (marked to fair value with appropriate risk adjustments), while the platform technology and origination capabilities are valued on a multiple of origination volume or revenue. A typical marketplace lender might be valued at 1.2x to 1.5x loan book value plus 2x to 4x platform revenue.
- Wealth and investment platforms: Valued primarily on assets under management (AUM) multiples, typically 2% to 4% of AUM for robo-advisors and digital wealth platforms, reflecting recurring revenue models and high customer lifetime values.
The Profitability Inflection Point
The fintech valuation landscape has undergone a dramatic reset since the exuberance of 2020-2021. Public fintech valuations peaked at a median of 15x forward revenue in late 2021 before collapsing to 3x to 4x by mid-2023. As we move through 2025, the market has stabilized around 4x to 6x revenue for profitable, growing fintechs, with significant premiums for companies demonstrating clear paths to 20%+ EBITDA margins.
The shift from growth-at-any-cost to profitable growth has fundamentally altered fintech M&A dynamics. Strategic acquirers—particularly traditional banks and insurers seeking digital capabilities—now focus intensely on unit economics, customer acquisition costs, and lifetime value ratios. A fintech with $100 million in revenue growing 40% annually but burning $30 million in cash might have been valued at $1.5 billion in 2021; in 2025, that same company would likely be valued at $400-500 million absent a clear path to profitability within 18-24 months.
Regulatory Capital Considerations for Fintech Acquisitions
When regulated financial institutions acquire fintechs, regulatory capital treatment becomes paramount. The goodwill and intangibles created in these transactions receive the same punitive capital treatment as traditional bank acquisitions—full deduction from CET1 capital. This creates a natural ceiling on valuation multiples that banks can pay for fintechs.
Consider a bank acquiring a lending platform for $500 million that has $50 million in tangible equity. The $450 million in goodwill must be deducted from the bank's CET1 capital. If the bank has a 10% CET1 ratio and the acquisition would reduce it to 9.2%, the bank must either raise capital, reduce dividends, or slow balance sheet growth to restore the ratio—all of which reduce the economic attractiveness of the deal.
This capital constraint has driven many banks toward minority investments and partnerships rather than outright acquisitions of high-multiple fintechs. It has also created opportunities for private equity firms and non-bank acquirers who face no regulatory capital constraints and can therefore pay higher multiples for attractive fintech franchises.
05 Comparable Transaction Analysis in Financial Services
Building a robust comparable transaction analysis for financial services M&A requires careful segmentation and normalization. The key dimensions for comparability include:
- Asset size and scale: Banks with $1-5 billion in assets trade at different multiples than those with $20-50 billion, reflecting different buyer universes and strategic value.
- Geographic footprint: Banks with concentrated deposit franchises in high-growth markets command premiums, while those in mature or declining markets trade at discounts.
- Business mix: Commercial banks, mortgage banks, and wealth managers have fundamentally different risk profiles and return characteristics.
- Asset quality metrics: Non-performing asset ratios, criticized asset levels, and reserve coverage ratios must be normalized across comparables.
- Profitability and efficiency: ROE, ROA, and efficiency ratios provide critical context for multiple analysis.
In practice, building a truly comparable set often yields only 5-10 transactions over a 2-3 year period. The scarcity of perfect comparables makes it essential to understand the specific drivers of each transaction and adjust multiples accordingly. A bank acquired at 1.8x book value with a 1.2% ROA and 95% efficiency ratio is not comparable to one acquired at 1.6x book value with a 1.0% ROA and 65% efficiency ratio, even if both are regional banks of similar size.
Cross-Border Considerations
Cross-border financial services transactions introduce additional complexity. Regulatory approval processes vary dramatically by jurisdiction, with some countries (notably the U.S., China, and increasingly the EU) imposing significant restrictions on foreign ownership of domestic financial institutions. Currency risk, different accounting standards, and varying regulatory capital regimes must all be factored into valuation.
European acquirers of U.S. targets must often pay premiums of 10-15% to compensate for regulatory uncertainty and longer approval timelines. Conversely, U.S. acquirers of European targets have historically paid discounts reflecting concerns about profitability and regulatory burden, though this discount has narrowed as European banking profitability has improved in the current rate environment.
06 The Impact of Interest Rate Environment on Financial Services Valuation
The dramatic shift in interest rate regimes from 2022 through 2025 has had profound effects on financial services valuation. For banks, the rapid rate increases of 2022-2023 initially appeared positive, expanding net interest margins. However, the subsequent deposit competition and unrealized securities losses created significant headwinds, particularly for institutions with high levels of held-to-maturity securities and rate-sensitive deposits.
As rates have stabilized in the 4-5% range through 2025, bank valuations have recovered substantially. The median P/BV multiple for U.S. bank M&A transactions has expanded from 1.25x in Q1 2023 to 1.55x in Q1 2025, reflecting improved visibility on net interest margin sustainability and reduced balance sheet risk.
For insurers, higher rates have been unambiguously positive, improving investment yields and reducing the present value of long-duration liabilities. Life insurance embedded values have increased by 15-25% on average from 2021 to 2025, driven entirely by the change in discount rates applied to future cash flows. This has created a favorable environment for insurance M&A, with transaction volumes in the sector up 35% year-over-year through Q1 2025.
07 Technology and Data as Valuation Drivers
The increasing importance of technology infrastructure and data analytics capabilities in financial services has created new valuation considerations. Traditional banks with modern core banking systems, robust digital channels, and advanced data analytics capabilities command premiums of 10-20% relative to peers with legacy technology stacks. The cost to modernize legacy systems—often $50-100 million for a mid-sized bank—must be factored into acquisition valuations as a day-two cost.
Similarly, the quality and completeness of customer data has emerged as a critical value driver. Financial institutions with rich customer data, strong data governance, and advanced analytics capabilities can cross-sell more effectively, manage risk more precisely, and personalize customer experiences. These capabilities are increasingly reflected in acquisition premiums, though quantifying the specific value of data assets remains challenging.
08 Looking Forward: The Evolution of Financial Services Valuation
As we look toward 2026 and beyond, several trends are likely to reshape financial services valuation:
First, the continued convergence of banking, insurance, and fintech will require valuation professionals to master multiple frameworks simultaneously. The traditional siloes between these sectors are eroding, with banks offering insurance products, insurers providing banking services, and fintechs expanding across both domains. Valuation approaches will need to become more flexible and hybrid in nature.
Second, environmental, social, and governance (ESG) factors are increasingly material to financial services valuation. Banks and insurers with strong ESG profiles and climate risk management capabilities are beginning to command modest premiums, though the magnitude remains difficult to quantify precisely. As climate-related financial disclosures become mandatory and climate risk becomes more salient, this premium is likely to expand.
Third, the regulatory landscape continues to evolve, with particular focus on operational resilience, cybersecurity, and third-party risk management. Financial institutions with robust risk management frameworks and strong regulatory relationships will command premiums, while those with regulatory issues or weak compliance cultures will face discounts or deal-breaking obstacles.
Finally, the role of technology in financial services valuation will only intensify. As artificial intelligence and machine learning become embedded in underwriting, risk management, and customer service, the ability to deploy these technologies effectively will become a critical differentiator. Acquirers will increasingly conduct detailed technology due diligence, and technology capabilities will drive larger portions of acquisition premiums.
The complexity of financial services M&A valuation demands sophisticated analytical tools and deep sector expertise. Platforms like iValuate enable professionals to efficiently analyze comparable transactions, adjust for regulatory capital impacts, and model complex deal structures—essential capabilities in a market where precision and speed determine competitive advantage.
For M&A advisors, corporate development teams, and private equity professionals operating in the financial services sector, mastering these valuation frameworks is not optional—it is the foundation of credible advice and successful transactions. The unique characteristics of financial institutions—regulatory capital constraints, balance sheet-centric business models, and the primacy of franchise value—require approaches that diverge fundamentally from industrial company valuation. Those who invest in developing this specialized expertise, supported by purpose-built analytical tools like iValuate, will be best positioned to navigate the complex and dynamic financial services M&A landscape in the years ahead.