Table of Contents9 sections
Valuing deep technology and biotechnology startups represents one of the most challenging exercises in corporate finance. Unlike software-as-a-service companies that can achieve product-market fit within 18-24 months, deep tech and biotech ventures often require 7-15 years of capital-intensive research and development before generating meaningful revenue. These companies face binary outcomes—a drug either receives FDA approval or it doesn't, a quantum computing breakthrough either works or it fails—making traditional discounted cash flow models inadequate for capturing their true economic value.
As we navigate through 2025-2026, the landscape for deep tech and biotech valuations has evolved considerably. Following the correction in growth equity markets during 2022-2023, investors have recalibrated their expectations, demanding more rigorous probability-weighted analyses and clearer paths to technical and commercial milestones. Global venture capital investment in biotech reached $38.2 billion in 2024, down from the $49.7 billion peak in 2021, but the quality of diligence and valuation rigor has substantially improved.
01 The Fundamental Challenge: Time, Capital, and Uncertainty
Deep tech and biotech startups operate under fundamentally different constraints than traditional technology companies. A typical enterprise software startup might require $15-30 million to reach Series B, with clear revenue traction and customer validation. In contrast, a biotech company developing a novel therapeutic might consume $100-250 million before completing Phase II clinical trials, with no guarantee of success and zero revenue generation during this period.
The capital intensity creates a unique valuation dynamic. These companies must raise substantial sums across multiple financing rounds, each occurring at critical technical milestones rather than revenue benchmarks. A Series B biotech company might be valued at $400 million despite having zero revenue, purely based on the successful completion of Phase I trials and the probability-adjusted value of its pipeline.
The Binary Nature of Technical Risk
Unlike market risk or execution risk, which exist on a continuum, technical risk in deep tech and biotech often presents as binary outcomes. Consider these scenarios:
- A gene therapy either demonstrates acceptable safety profiles in trials or triggers adverse events that terminate development
- A novel battery chemistry either achieves the target energy density at commercial scale or fails to overcome fundamental material science limitations
- A quantum computing architecture either maintains coherence at the required scale or succumbs to decoherence that makes it commercially unviable
This binary nature demands valuation methodologies that explicitly incorporate probability trees and decision analysis, rather than simple sensitivity analyses around base-case assumptions.
02 Risk-Adjusted Net Present Value (rNPV): The Gold Standard
The risk-adjusted net present value methodology has emerged as the preferred framework for valuing deep tech and biotech ventures. Unlike traditional NPV, which applies a single discount rate to expected cash flows, rNPV explicitly models the probability of success at each development stage and applies appropriate discount rates to probability-weighted outcomes.
Core Components of rNPV Analysis
A rigorous rNPV model for a biotech therapeutic typically includes:
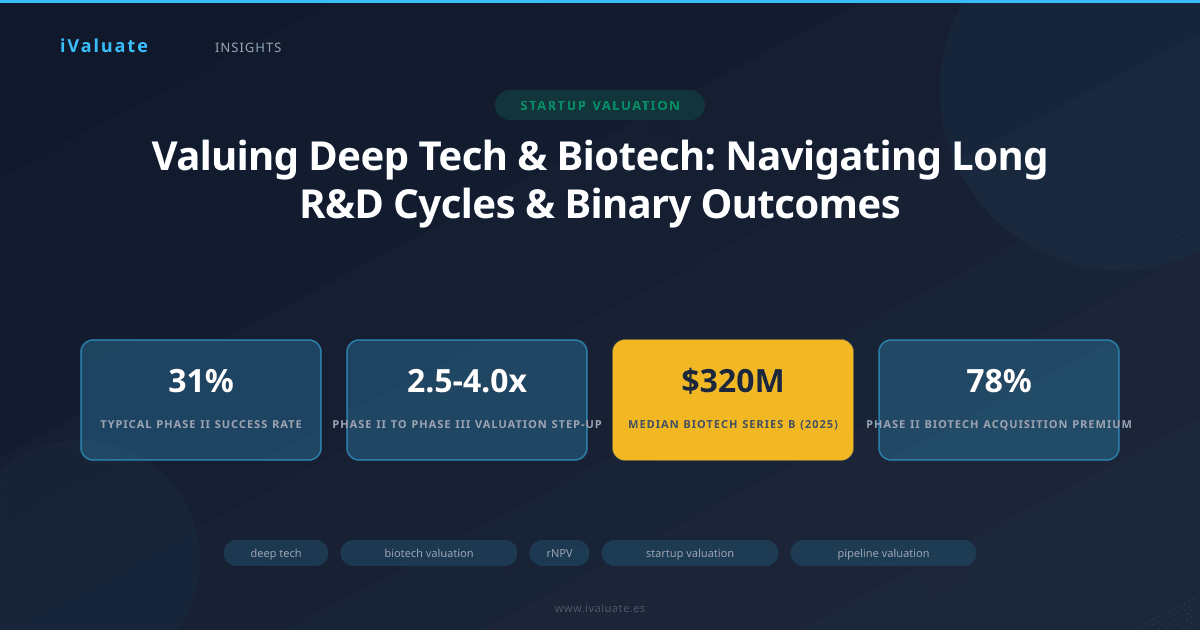
- Probability of Technical Success (PTS): Historical data shows Phase I clinical trials have approximately 63% success rates, Phase II trials 31%, and Phase III trials 58%. These probabilities vary significantly by therapeutic area—oncology drugs face lower success rates (Phase II: 24%) while vaccines show higher rates (Phase II: 42%)
- Development Timeline: Detailed Gantt charts mapping preclinical work, IND filing, clinical trial phases, regulatory review periods, and commercial launch timelines, typically spanning 10-15 years from discovery to market
- Development Costs: Stage-specific capital requirements, including preclinical research ($5-15 million), Phase I trials ($15-30 million), Phase II trials ($40-80 million), and Phase III trials ($100-300 million)
- Peak Sales Projections: Market-based revenue forecasts incorporating epidemiology data, pricing assumptions, market penetration curves, and competitive dynamics
- Commercial Margins: Gross and operating margins reflecting manufacturing costs, sales and marketing expenses, and ongoing pharmacovigilance requirements
The discount rate applied in rNPV models typically ranges from 10-15% for late-stage assets with de-risked technical profiles, to 30-50% for early-stage, preclinical programs. These rates reflect both the time value of money and the company-specific execution risk, but notably do NOT include the technical risk, which is captured explicitly through probability adjustments.
Practical Example: Oncology Therapeutic
Consider a Series B biotech company developing a novel small molecule for non-small cell lung cancer. The company has completed Phase I trials demonstrating acceptable safety and preliminary efficacy signals. An rNPV analysis might structure as follows:
Phase II (Current Stage): $60 million cost over 2.5 years, 28% probability of success given the oncology indication. Probability-weighted cost: $16.8 million.
Phase III: $180 million cost over 3.5 years, conditional on Phase II success. Combined probability (Phase II × Phase III): 28% × 58% = 16.2%. Probability-weighted cost: $29.2 million.
Commercial Launch: Assuming regulatory approval (conditional probability now 16.2%), peak sales of $850 million in year 7 post-launch, with 72% gross margins and 35% operating margins. The probability-weighted NPV of these cash flows, discounted at 12%, might yield $420 million.
Subtracting the probability-weighted development costs from the probability-weighted commercial value, and adding back any existing cash, produces the rNPV. In this example, assuming $40 million in cash, the pre-money valuation might be: $420M - $46M + $40M = $414 million.
03 Pipeline Valuation: Aggregating Multiple Shots on Goal
Many deep tech and biotech companies maintain multiple programs at various development stages, creating a portfolio effect that can significantly impact overall valuation. Pipeline valuation requires aggregating the rNPV of each program while accounting for correlations, shared infrastructure costs, and platform value.
Platform vs. Product Value
A critical distinction in deep tech and biotech valuation is separating platform value from individual product value. A company with a proprietary mRNA delivery platform, for instance, might have three specific therapeutic programs in development, but the platform itself has option value for future programs beyond those currently in the pipeline.
In 2024-2025, we've seen platform companies command significant premiums. Moderna's 2020 valuation incorporated not just its COVID-19 vaccine program but the potential for its mRNA platform to address dozens of other indications. Similarly, quantum computing companies are valued not just on their current qubit counts but on the scalability of their underlying architecture.
Valuation practitioners typically model platform value through one of two approaches:
- Probability-weighted option value: Assigning probabilities and potential values to future programs that could leverage the platform, discounted heavily for both time and uncertainty
- Comparable platform multiples: Examining transactions where platform companies were acquired, extracting implied multiples per program or per validated mechanism of action
Portfolio Correlation and Diversification
When valuing a multi-asset pipeline, a key question is whether to apply a portfolio discount or premium. If all programs target the same mechanism of action, failure of one program might signal higher failure probability for others (positive correlation). Conversely, if programs address entirely different therapeutic areas using distinct approaches, the portfolio provides genuine diversification value.
In practice, most biotech pipelines show modest positive correlation (0.2-0.4) because they share common platform risks, regulatory pathways, and management execution capabilities. This typically results in a 10-15% portfolio discount when aggregating individual program rNPVs.
04 Milestone-Based Valuation and Step-Up Analysis
Given the discrete, binary nature of technical progress in deep tech and biotech, valuations often hinge on specific milestones. Understanding the expected valuation step-up associated with achieving key milestones is essential for both founders and investors.
Typical Milestone Categories
Technical Milestones:
- Proof-of-concept in animal models
- IND clearance from FDA
- Phase I safety data
- Phase II efficacy data
- Phase III topline results
- Regulatory approval (FDA, EMA)
Commercial Milestones:
- First commercial sale
- Formulary inclusion by major payers
- Achievement of specific revenue thresholds
- Successful manufacturing scale-up
Strategic Milestones:
- Key partnership or licensing agreements
- Expansion into new indications
- Platform validation through multiple programs
Quantifying Step-Ups
Historical data from 2023-2025 biotech financings reveals typical valuation step-ups:
- Preclinical to Phase I initiation: 1.8-2.5x step-up, reflecting reduced regulatory uncertainty
- Phase I completion to Phase II initiation: 2.0-3.0x step-up, as safety is established
- Positive Phase II data: 2.5-4.0x step-up, the most significant value inflection as efficacy is demonstrated
- Phase III initiation to completion: 1.5-2.2x step-up, reflecting reduced technical risk but increased capital requirements
- Regulatory approval: 1.3-1.8x step-up from Phase III completion, as commercial execution risk becomes primary
These multiples vary significantly by indication, competitive landscape, and market conditions. In hot therapeutic areas like obesity or Alzheimer's disease, step-ups can be substantially higher. Conversely, in crowded spaces with multiple approved therapies, step-ups may be compressed.
Case Study: Gene Therapy Valuation Evolution
A gene therapy company we'll call "GenecoRx" illustrates milestone-based valuation dynamics. In early 2023, GenecoRx completed a $45 million Series B at a $180 million post-money valuation, with its lead program in preclinical development for a rare genetic disorder affecting approximately 8,000 patients in the US and EU.
By mid-2024, GenecoRx announced positive Phase I/II data showing meaningful clinical benefit in 12 of 15 treated patients, with acceptable safety profiles. The company raised a $120 million Series C at a $650 million post-money valuation—a 3.6x step-up in just 18 months. The valuation reflected:
- De-risked safety and preliminary efficacy, increasing probability of ultimate approval from 12% to 35%
- Clear regulatory pathway with FDA Breakthrough Therapy designation
- Expanded addressable market as data suggested potential for broader patient population
- Increased certainty around peak sales estimates ($600-800 million) and pricing ($1.2-1.5 million per patient)
This example demonstrates how binary outcomes drive step-change valuations rather than linear appreciation.
05 Special Considerations for Deep Tech Beyond Biotech
While biotech provides the most mature frameworks for long-cycle, binary-outcome valuations, other deep tech sectors face similar challenges with sector-specific nuances.
Quantum Computing and Advanced Hardware
Quantum computing companies face technical milestones around qubit count, coherence times, error rates, and ultimately quantum advantage for commercially relevant problems. Valuation requires assessing:
- Probability of achieving quantum advantage within investment horizon
- Competitive positioning across different qubit modalities (superconducting, trapped ion, topological)
- Path to commercial scale and cost structure
- Breadth of addressable use cases beyond initial applications
In 2025, quantum computing valuations have become more disciplined following the 2021-2022 SPAC boom and subsequent correction. Investors now demand clear technical roadmaps with measurable milestones, similar to biotech's clinical trial phases.
Fusion Energy and Climate Tech
Fusion energy companies exemplify extreme long-cycle deep tech. With development timelines potentially exceeding 15-20 years and capital requirements in the billions, these ventures require patient capital and specialized valuation approaches. Key considerations include:
- Technical feasibility milestones (net energy gain, Q-factor improvements, sustained burn)
- Engineering and commercialization challenges beyond scientific proof-of-concept
- Regulatory pathways and public acceptance
- Competitive dynamics with renewable energy alternatives
- Government support and public-private partnership structures
Fusion companies that achieved net energy gain in 2024-2025 saw significant valuation step-ups, though absolute valuations remain challenging to benchmark given limited comparables and extreme uncertainty.
06 Valuation in Practice: Data Rooms and Due Diligence
For investors conducting due diligence on deep tech and biotech companies, the data room must support rigorous probability and milestone analysis. Essential materials include:
- Technical documentation: Detailed research data, experimental protocols, manufacturing processes, and intellectual property landscapes
- Regulatory strategy: Interaction with regulatory agencies, clinical trial designs, regulatory timelines, and approval strategies
- Market analysis: Epidemiology data, competitive landscape, pricing benchmarks, reimbursement dynamics, and commercial launch plans
- Financial models: Detailed rNPV models with transparent assumptions, sensitivity analyses, and scenario planning
- Risk assessment: Comprehensive identification of technical, regulatory, commercial, and competitive risks with mitigation strategies
Sophisticated investors increasingly employ technical consultants—former FDA reviewers, academic researchers, industry veterans—to assess probability assumptions. A 5-10 percentage point difference in Phase III success probability can swing valuations by $100-200 million for a late-stage biotech.
07 Market Dynamics and Valuation Trends (2025-2026)
The deep tech and biotech valuation environment in 2025-2026 reflects several key trends:
Flight to Quality: Following the market correction of 2022-2023, investors have become more selective, favoring companies with validated platforms, experienced management teams, and clear technical milestones. Median Series B valuations for biotech companies with Phase I data have compressed from $450 million in 2021 to $320 million in 2025, while truly differentiated assets command premiums.
Increased Scrutiny of Probabilities: Investors are challenging overly optimistic probability assumptions. The days of applying 50% Phase II success rates across the board are over; investors now demand indication-specific, mechanism-specific probability assessments backed by historical data and expert opinions.
Milestone-Based Tranches: More venture rounds are structured with milestone-based tranches, where initial closes fund near-term milestones and subsequent tranches release upon achievement. This aligns incentives and reduces capital at risk, but requires careful valuation of the conditional tranches.
Strategic Interest: Large pharmaceutical and technology companies have remained active acquirers of deep tech and biotech assets, often paying significant premiums to venture valuations. In 2024, the median acquisition premium for Phase II biotech assets was 78% over the last venture round, reflecting the strategic value of pipeline diversification and platform access.
Key Takeaway: Deep tech and biotech valuations require abandoning traditional DCF approaches in favor of probability-weighted, milestone-driven frameworks that explicitly model binary technical risks. The rNPV methodology, combined with rigorous probability assessment and clear milestone mapping, provides the most defensible valuation foundation for these unique ventures.
08 Practical Implications for Stakeholders
For Founders and Management Teams
Understanding the valuation drivers in deep tech and biotech is essential for effective capital raising and stakeholder communication. Key recommendations:
- Build detailed rNPV models early, even if approximate, to understand value drivers and optimal financing strategy
- Focus on achieving clear, binary milestones that drive step-up valuations rather than incremental progress
- Maintain rigorous documentation of technical progress to support probability assessments
- Consider strategic partnerships that validate technology and reduce perceived risk
- Be realistic about probability assumptions—overly aggressive projections undermine credibility
For Investors
Effective deep tech and biotech investing requires specialized diligence capabilities:
- Build or access technical expertise to independently assess probability assumptions
- Understand the specific risk profile of different development stages and modalities
- Model multiple scenarios and stress-test key assumptions
- Consider portfolio construction to diversify across stages, indications, and technical approaches
- Structure investments with milestone-based protections where appropriate
For Acquirers and Strategic Partners
Corporate acquirers must balance internal development capabilities against external innovation:
- Develop clear thresholds for technical validation before acquisition
- Structure deals with milestone-based earnouts to share risk
- Consider platform value beyond individual assets
- Assess cultural and operational fit for successful integration
09 Looking Forward: The Evolution of Deep Tech Valuation
As we progress through 2025 and into 2026, several developments are shaping the future of deep tech and biotech valuation:
AI-Enabled Drug Discovery: Companies leveraging artificial intelligence for target identification and molecule design are compressing development timelines and potentially improving success probabilities. This creates new valuation paradigms where platform value may exceed individual asset value by wider margins.
Regulatory Innovation: Accelerated approval pathways, adaptive trial designs, and real-world evidence are changing the risk-reward calculus. Valuations must adapt to these evolving regulatory frameworks.
Market Access Complexity: Increasing payer scrutiny and value-based pricing models add commercial risk that must be incorporated into rNPV models alongside technical risk.
Cross-Sector Convergence: The boundaries between biotech, medtech, digital health, and AI are blurring, creating hybrid business models that require integrated valuation approaches.
The fundamental challenge remains: how do we assign present value to uncertain future breakthroughs that could transform industries or fail completely? The answer lies in rigorous probability assessment, milestone-driven analysis, and continuous refinement of assumptions as new data emerges.
For professionals navigating these complex valuations, specialized analytical tools have become indispensable. Platforms like iValuate enable practitioners to build sophisticated probability-weighted models, conduct scenario analyses, and benchmark assumptions against market data—capabilities that are essential for defensible valuations in this challenging sector. As deep tech and biotech continue to push the boundaries of human knowledge and capability, our valuation frameworks must evolve with equal rigor and sophistication.