Table of Contents9 sections
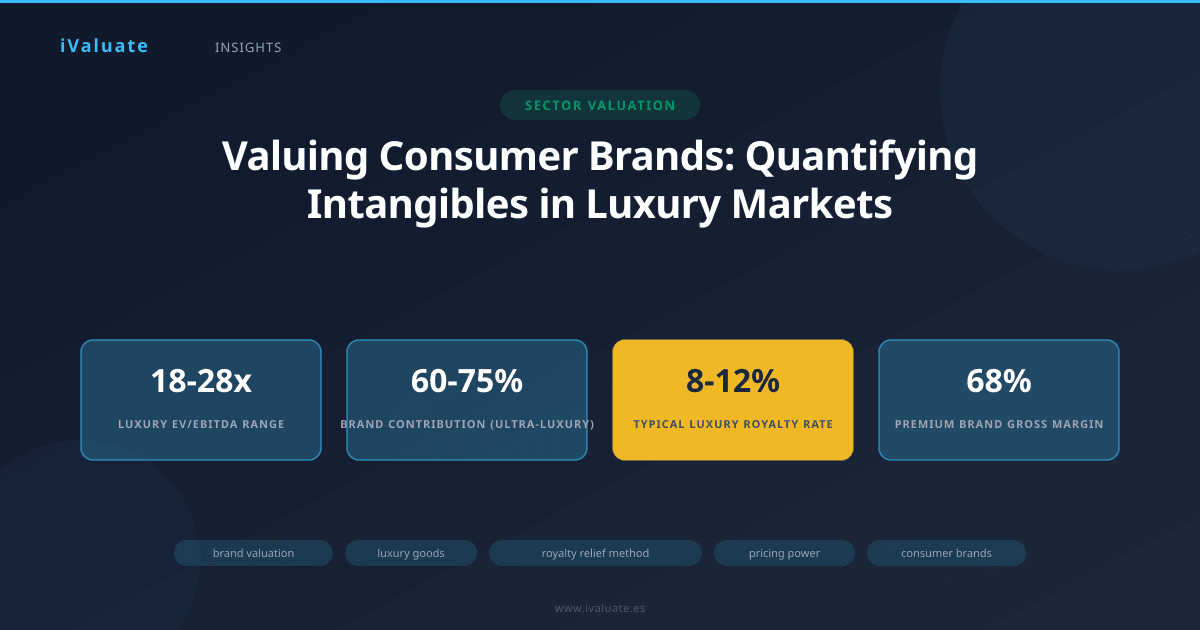
The valuation of consumer brands and luxury goods presents one of the most intellectually challenging exercises in corporate finance. Unlike capital-intensive manufacturers or asset-heavy retailers, the enterprise value of companies like LVMH, Hermès, or Estée Lauder derives predominantly from intangible assets—brand equity, customer loyalty, and pricing power—that don't appear on traditional balance sheets. As of early 2025, luxury conglomerates trade at EV/EBITDA multiples ranging from 18x to 28x, compared to 8-12x for mass-market consumer goods, reflecting the market's recognition that brand value creates sustainable competitive advantages and superior cash flow generation.
This premium valuation isn't arbitrary. It reflects measurable economic phenomena: the ability to command prices 300-500% above production costs, customer lifetime values exceeding $50,000 in ultra-luxury segments, and retention rates above 85% among high-net-worth consumers. For valuation professionals, the challenge lies in translating these qualitative advantages into defensible quantitative adjustments within DCF models, comparable company analyses, and transaction multiples.
01 The Economics of Brand Value in Consumer Markets
Brand value represents the incremental cash flows a company generates specifically because of its brand recognition, reputation, and customer associations. In consumer goods, this manifests through three primary economic mechanisms: pricing power, volume premiums, and capital efficiency. A Louis Vuitton handbag with a production cost of $800 retails for $3,500-$5,000 not because of superior materials or craftsmanship alone, but because the brand commands a luxury premium that consumers willingly pay.
Recent market data illustrates the magnitude of this effect. Analysis of 2024 financial results across 45 publicly traded luxury and premium consumer brands reveals that companies with brand values exceeding $10 billion (as measured by independent brand valuation consultancies) achieved median gross margins of 68%, compared to 42% for brands valued below $2 billion. This 26-percentage-point differential translates directly to EBITDA margins that average 28% versus 16%, creating a compounding effect on enterprise value.
Quantifying Brand Contribution to Enterprise Value
The brand contribution to total enterprise value varies significantly by category and market positioning. In ultra-luxury goods (Hermès, Patek Philippe, Brunello Cucinelli), brand equity typically represents 60-75% of enterprise value. For accessible luxury and premium brands (Coach, Michael Kors, Hugo Boss), the proportion ranges from 35-50%. Mass-premium consumer goods (Coca-Cola, Unilever premium tiers) see brand contributions of 25-40%.
These percentages aren't theoretical constructs. They're derived from relief-from-royalty analyses, brand migration studies, and conjoint analyses that isolate brand-specific value drivers. When Procter & Gamble divested 43 beauty brands to Coty in 2016 for $12.5 billion, subsequent analysis revealed that approximately $8.2 billion of the transaction value was attributable to brand equity, with the remainder allocated to customer relationships, formulations, and tangible assets.
02 The Royalty Relief Method: Industry Standard for Brand Valuation
The royalty relief method has emerged as the dominant approach for valuing brands within consumer goods companies, endorsed by both ISO 10668 (Brand Valuation standard) and widely accepted by tax authorities for transfer pricing purposes. The methodology rests on a straightforward premise: if a company didn't own its brand, it would need to license it from a third party, paying ongoing royalties. The present value of these avoided royalty payments represents the brand's economic value.
Constructing a Royalty Relief Analysis
The technical execution requires several critical inputs. First, revenue forecasts must be segmented by brand, incorporating realistic growth assumptions that reflect category dynamics, geographic expansion potential, and competitive positioning. For a premium skincare brand expanding in Asia, this might project 8-12% annual growth over a five-year explicit period, compared to 3-5% for mature Western markets.
Second, determining the appropriate royalty rate demands both market benchmarking and brand-specific adjustments. Licensing databases such as ktMINE and RoyaltyRange provide transaction-based evidence. For luxury fashion and accessories, market royalty rates typically range from 8-12% of net sales. Premium beauty and cosmetics command 6-10%, while mass-market consumer packaged goods see 2-5%. These rates must be adjusted for brand strength, market position, and geographic scope.
A practical example: When valuing a premium athletic apparel brand generating $850 million in annual revenue, a valuation professional might apply a 9% royalty rate (benchmarked against comparable licensing agreements in the sector). After deducting a 30% tax benefit (since royalty payments would be tax-deductible), the effective after-tax royalty savings equals 6.3% of revenue, or approximately $53.6 million annually. Discounting these cash flows at a brand-specific WACC of 9.5% (reflecting lower risk than operating assets) over a 15-year period with terminal value yields a brand value in the range of $480-520 million—representing roughly 55-60% of the company's enterprise value at typical sector multiples.
Critical Adjustments and Refinements
Sophisticated practitioners make several important refinements to baseline royalty relief calculations. Brand fade rates must be incorporated, recognizing that brand value doesn't persist indefinitely without continued investment. For fashion brands, annual fade rates of 2-4% are typical; for heritage luxury brands with multi-generational equity (Chanel, Rolex), fade rates below 1% may be justified.
Marketing expense normalization represents another crucial adjustment. If current marketing spend significantly exceeds or falls short of the level required to maintain brand strength, the royalty relief calculation should reflect normalized, sustainable spending levels. A brand currently investing 18% of revenue in marketing to drive rapid growth might require only 12% to maintain position once maturity is reached, affecting both the royalty base and the incremental cash flows attributable to brand ownership.
03 Pricing Power: The Ultimate Brand Value Indicator
While royalty relief provides a structured valuation framework, pricing power represents the most tangible manifestation of brand value and the metric most directly observable by investors and acquirers. Pricing power exists when a brand can raise prices above inflation without proportional volume loss, or alternatively, maintain price premiums over comparable products without market share erosion.
The luxury sector provides the clearest demonstration. LVMH's fashion and leather goods division has implemented price increases averaging 5-8% annually over the past decade, compared to inflation rates of 2-3% in key markets, while simultaneously growing unit volumes by 4-6% annually. This pricing power translates to revenue growth of 10-15% annually from existing product lines, before considering new product introductions or geographic expansion.
Measuring and Modeling Pricing Power
Quantifying pricing power for valuation purposes requires analyzing historical pricing actions and their volume impacts. Price elasticity of demand becomes the critical metric. Ultra-luxury brands often exhibit price elasticities between -0.2 and -0.4, meaning a 10% price increase results in only 2-4% volume decline—a highly profitable trade-off. Premium brands typically show elasticities of -0.6 to -0.8, while mass-market brands face elasticities of -1.2 to -1.8, where price increases directly erode profitability.
In DCF models, pricing power manifests through revenue growth assumptions and margin expansion trajectories. Consider two hypothetical premium beauty brands, each generating $500 million in revenue with 25% EBITDA margins. Brand A, with demonstrated pricing power, can credibly project 3% annual price increases (above 2% inflation) plus 2% volume growth, yielding 5% revenue growth with margin expansion to 28% over five years as price increases flow through at minimal incremental cost. Brand B, lacking pricing power, must rely entirely on volume growth of 3% annually with flat margins. Over a ten-year DCF horizon at a 10% discount rate, Brand A's enterprise value would be approximately 35-40% higher, all else equal.
Case Study: Hermès International
Hermès exemplifies extreme pricing power and its valuation implications. The company has increased prices on its iconic Birkin and Kelly handbags by 6-8% annually for over 15 years, with bags that sold for $6,000 in 2005 now commanding $12,000-$15,000, while waiting lists have lengthened rather than shortened. This pricing trajectory, combined with controlled supply that maintains scarcity, has driven EBITDA margins from 27% in 2015 to 42% in 2024.
The market rewards this pricing power with a premium valuation. As of early 2025, Hermès trades at approximately 45x forward EBITDA and 52x forward earnings, multiples that would be unjustifiable for a conventional manufacturer but reflect investor recognition that the brand's pricing power creates a perpetual growth option with minimal execution risk. The company's enterprise value of approximately €220 billion implies a brand value exceeding €150 billion using royalty relief methodology—one of the world's most valuable commercial brands.
04 Customer Loyalty and Lifetime Value in Brand Valuation
Customer loyalty represents the third pillar of brand value, translating to predictable revenue streams, lower customer acquisition costs, and reduced sensitivity to competitive actions. In luxury and premium consumer goods, loyalty manifests through repeat purchase rates, share of wallet, and willingness to follow brands across categories.
The economics are compelling. Analysis of CRM data from premium beauty brands reveals that customers who make three or more purchases have a 75-85% probability of remaining active over a five-year period, with average annual spending increasing by 15-25% over that timeframe. In contrast, single-purchase customers show retention rates below 30%. This disparity means that a brand with superior loyalty economics can generate 3-4x the lifetime value per acquired customer compared to competitors with weaker brand equity.
Incorporating Loyalty Metrics into Valuation Models
Forward-looking valuation models should incorporate customer cohort analysis and lifetime value projections. For a premium skincare brand, this might involve segmenting the customer base into cohorts by acquisition year and analyzing retention curves, purchase frequency, and average order values. A brand demonstrating 70% year-two retention and 60% year-three retention can support more aggressive growth assumptions and lower customer acquisition cost requirements than one showing 45% and 30% retention rates.
These metrics also inform comparable company selection and multiple adjustments. When benchmarking a target company against public comparables, adjustments should reflect loyalty differentials. A brand with Net Promoter Scores (NPS) of 65-70 and documented retention rates 15-20 percentage points above sector averages justifies a 15-25% premium to median sector multiples, translating to perhaps 2-3 additional turns of EBITDA in transaction pricing.
Key Valuation Insight: Customer lifetime value in luxury goods can exceed $50,000 for ultra-high-net-worth segments and $8,000-$12,000 for accessible luxury customers. Brands that successfully migrate customers up the value chain create compounding value that traditional metrics often understate.
05 The Luxury Premium: Structural Advantages in Valuation
Luxury brands command structural valuation premiums that extend beyond individual metrics to encompass entire business models. These premiums reflect several interconnected advantages: superior capital efficiency, resilience through economic cycles, geographic diversification potential, and the self-reinforcing nature of luxury positioning.
Capital Efficiency and Return Profiles
Luxury brands typically generate returns on invested capital (ROIC) of 25-45%, compared to 12-18% for premium brands and 8-12% for mass-market consumer goods. This differential stems from minimal working capital requirements (luxury goods often receive customer deposits before production), limited capital expenditure needs (outsourced manufacturing is common), and the ability to generate cash flow from brand licensing without incremental investment.
Brunello Cucinelli, the Italian luxury menswear brand, exemplifies this capital efficiency. The company generates ROIC exceeding 35% while maintaining EBITDA margins of 18-20%—lower than pure-play luxury houses but exceptional for a vertically integrated manufacturer. This performance supports an EV/EBITDA multiple of 22-25x, approximately double the multiple of premium menswear competitors with similar growth rates but lower returns on capital.
Counter-Cyclical Resilience
Contrary to intuition, true luxury brands often demonstrate remarkable resilience during economic downturns. Analysis of luxury conglomerate performance during the 2008-2009 financial crisis, the 2020 pandemic, and the 2022-2023 inflation surge reveals that ultra-luxury segments (products above $5,000) experienced revenue declines of only 8-12% during severe recessions, recovering within 12-18 months. Accessible luxury saw declines of 18-25% with 24-36 month recovery periods, while premium and mass-market segments declined 25-35% with recoveries extending beyond three years.
This resilience reflects the concentration of luxury consumption among the top 1-2% of wealth holders, whose spending patterns show low correlation with GDP fluctuations. For valuation purposes, this translates to lower beta assumptions (0.8-1.0 for luxury versus 1.1-1.3 for mass premium) and potentially lower discount rates, creating meaningful valuation uplift through the cost of capital component of DCF models.
06 Practical Application: Building a Brand-Adjusted Valuation Model
Integrating brand value considerations into a comprehensive valuation requires a structured, multi-method approach. Best practice involves triangulating between three methodologies: DCF with brand-specific adjustments, royalty relief for brand value isolation, and precedent transactions with brand quality normalization.
DCF Framework with Brand Adjustments
The DCF model should incorporate brand strength through several channels. Revenue growth assumptions must reflect demonstrated pricing power and customer loyalty, typically adding 100-300 basis points to base-case growth for strong brands. Margin trajectories should account for the operating leverage inherent in pricing power—each 1% price increase in a business with 65% gross margins and 25% EBITDA margins contributes approximately 2.6 percentage points to EBITDA margin expansion.
Terminal value calculations deserve particular attention. While perpetual growth rates of 2.5-3.0% are standard for mature businesses, brands with enduring pricing power and demonstrated multi-generational appeal may justify terminal growth rates of 3.5-4.0%, particularly in categories with structural tailwinds like premiumization in emerging markets. This seemingly modest adjustment—50-100 basis points—can increase enterprise value by 8-12% given that terminal value typically represents 60-75% of total DCF value.
Transaction Comparables with Brand Quality Adjustments
When analyzing precedent transactions, crude multiple comparisons obscure critical brand quality differences. A more rigorous approach segments transactions by brand strength indicators: royalty rates (as proxy for brand power), price positioning (average transaction values), and customer demographics (income levels of core customers).
For example, recent luxury brand acquisitions show a clear multiple progression: heritage luxury brands with royalty rate equivalents above 10% traded at 24-32x EBITDA; established luxury brands at 8-10% royalty equivalents traded at 18-24x EBITDA; and emerging luxury/premium brands at 5-8% equivalents traded at 12-18x EBITDA. Applying these band-adjusted multiples provides more defensible valuation ranges than sector-wide median multiples.
07 Emerging Considerations: Digital Transformation and Brand Value
The digital transformation of luxury and consumer brands introduces new valuation considerations. Direct-to-consumer (DTC) channels now represent 25-35% of luxury sales, up from 10-15% pre-pandemic, fundamentally altering brand economics. DTC sales typically generate gross margins 15-20 percentage points higher than wholesale, while providing invaluable first-party customer data that enhances loyalty programs and personalization.
However, DTC also requires significant digital marketing investment and technology infrastructure. Brands achieving sustainable DTC penetration above 40% demonstrate a different cost structure—lower gross margins from wholesale but higher marketing expenses—that must be carefully modeled. The valuation implication isn't uniformly positive; rather, it depends on execution quality and customer acquisition efficiency.
Sustainability and ESG considerations increasingly influence brand value, particularly among younger luxury consumers. Brands demonstrating authentic sustainability commitments (Stella McCartney, Patagonia in premium outdoor) command pricing premiums of 8-15% and show higher loyalty metrics among consumers under 40. As this demographic cohort accumulates wealth over the next decade, sustainability-linked brand equity will likely justify explicit valuation adjustments.
08 Risk Factors and Valuation Haircuts
Brand-driven valuations also carry specific risks that warrant discount rate adjustments or probability-weighted scenario analysis. Brand dilution through over-distribution or inappropriate brand extensions can rapidly erode value—Michael Kors' experience with outlet proliferation in 2014-2016 saw the brand's implied value decline by approximately 40% as pricing power evaporated.
Key person risk affects brands closely associated with founder-designers. The death of Karl Lagerfeld in 2019 created uncertainty around Chanel's creative direction, though the brand's institutional strength ultimately prevailed. Smaller brands with less institutional depth should incorporate key person discounts of 10-20% or model explicit succession scenarios.
Geographic concentration presents another risk factor. Brands deriving more than 40% of revenue from a single region face higher volatility from regional economic shocks or regulatory changes. China's luxury consumption slowdown in 2022-2023 disproportionately impacted brands with 50%+ Greater China exposure, suggesting that geographic diversification deserves explicit consideration in risk assessment.
09 Conclusion: The Art and Science of Brand Valuation
Valuing consumer brands and luxury goods demands both technical rigor and qualitative judgment. The quantitative frameworks—royalty relief, pricing power analysis, customer lifetime value modeling—provide essential structure and defensibility. Yet the ultimate valuation conclusion requires synthesizing these metrics with informed perspectives on brand trajectory, competitive positioning, and management's ability to preserve and enhance brand equity over time.
The stakes are substantial. In transactions involving premium and luxury brands, brand value typically represents 40-70% of total consideration. Overvaluing brand strength by 20% translates to 8-14% overpayment on enterprise value. Conversely, failing to recognize sustainable pricing power and customer loyalty can result in leaving significant value on the table, whether in M&A negotiations or capital raising contexts.
As consumer markets continue premiumizing globally—with the luxury goods market projected to reach $450-500 billion by 2027 and premium segments growing at 2-3x the rate of mass markets—the ability to accurately value brand-driven businesses becomes increasingly critical for investment professionals, corporate development teams, and business owners contemplating strategic alternatives.
Modern valuation platforms like iValuate increasingly incorporate brand-specific analytics and comparable screening capabilities that enable professionals to execute these sophisticated analyses efficiently, combining proprietary databases of brand transactions with modeling frameworks that properly account for intangible value drivers. As the consumer landscape evolves, the tools and methodologies for valuing its most valuable assets—the brands themselves—will continue advancing, but the fundamental principle remains constant: brand value is real, measurable, and central to understanding enterprise value in consumer markets.