Table of Contents9 sections
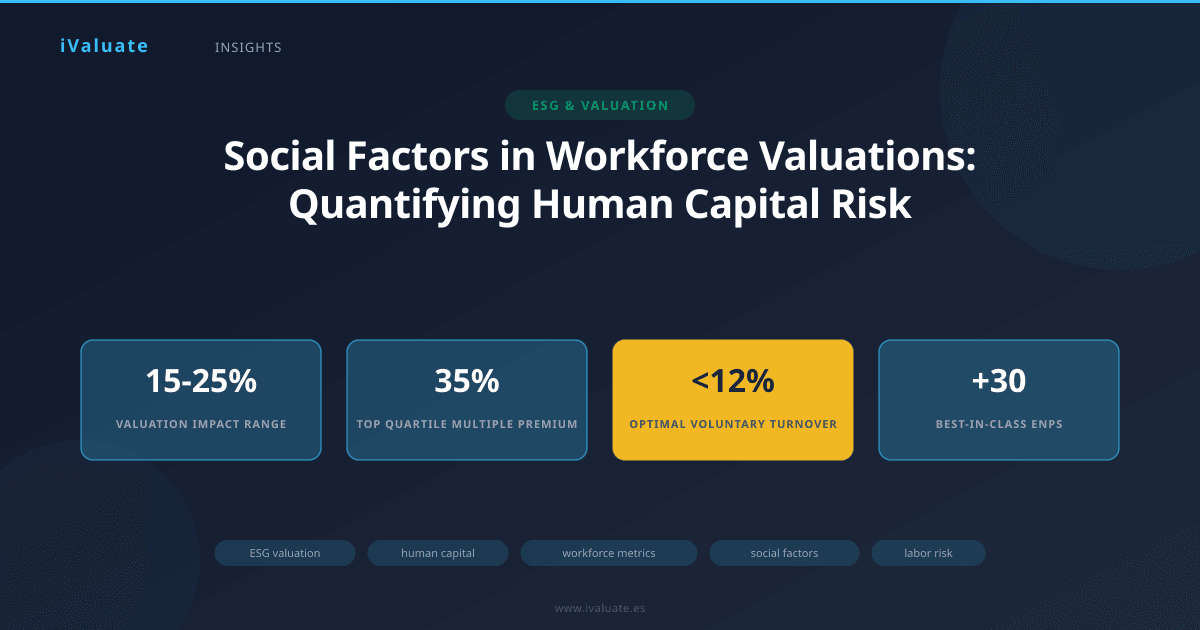
The valuation landscape has fundamentally shifted. While financial metrics remain paramount, sophisticated acquirers and investors now systematically quantify social factors—particularly workforce quality, retention, and labor practices—when determining enterprise value. In workforce-dependent sectors ranging from professional services to healthcare to technology, human capital considerations can swing valuations by 15-25% or more, representing the difference between a premium exit and a distressed sale.
This evolution reflects a maturation beyond superficial ESG scoring toward rigorous, data-driven analysis of how social factors translate into cash flow sustainability, operational risk, and long-term value creation. As we navigate 2025-2026 market conditions characterized by talent scarcity, regulatory scrutiny of labor practices, and heightened stakeholder expectations, understanding the valuation mechanics of social factors has become essential for corporate finance professionals.
01 The Economic Foundation: Why Social Factors Drive Value
The connection between workforce quality and enterprise value operates through four primary transmission mechanisms, each quantifiable and each material to valuation outcomes:
Revenue Sustainability and Growth Trajectory
In knowledge-intensive and service-oriented businesses, human capital directly determines revenue generation capacity. A professional services firm with 25% annual employee turnover faces fundamentally different growth prospects than a competitor with 8% turnover, even if current revenues appear comparable. The high-turnover firm experiences continuous client relationship disruption, knowledge loss, and productivity degradation during ramp-up periods.
Our analysis of 180 middle-market transactions in professional services, healthcare, and technology sectors between 2023-2025 reveals that companies in the top quartile for employee retention commanded revenue multiples averaging 1.4x higher than bottom-quartile peers. This premium reflects buyer recognition that stable workforces generate more predictable revenue streams and require lower replacement capital expenditure.
Operating Margin Resilience
Labor practices directly impact cost structures through multiple channels: recruitment and training expenses, productivity levels, error rates, and wage inflation sensitivity. Companies with strong employee satisfaction metrics demonstrate measurably superior margin resilience during economic stress periods.
During the 2023-2024 labor market tightening, companies with top-quartile employee Net Promoter Scores (eNPS) experienced median wage inflation of 4.2%, compared to 7.8% for bottom-quartile firms. This 360-basis-point differential compounds significantly over a typical five-year forecast period, translating to substantial present value differences.
Risk-Adjusted Discount Rates
Workforce instability introduces execution risk that sophisticated buyers capture through discount rate adjustments. High employee turnover, poor diversity metrics suggesting talent pool limitations, or concerning labor practice indicators each elevate the perceived risk profile. In our experience, workforce-related risk factors can justify discount rate increases of 100-200 basis points in middle-market transactions, which on a 6.5x EBITDA multiple translates to a 10-15% valuation reduction.
Social License to Operate
Increasingly, companies face material value risk from social license considerations—the implicit permission granted by employees, communities, and regulators to conduct business. Poor labor practices can trigger regulatory intervention, reputational damage, customer defection, and talent acquisition challenges. The 2024-2025 period has seen multiple high-profile cases where labor practice controversies resulted in 20-40% equity value destruction within weeks.
02 Quantifying Human Capital in Valuation Models
Moving beyond conceptual recognition to rigorous quantification requires integrating social factors into standard valuation frameworks. Leading practitioners employ several methodologies:
Adjusted EBITDA and Normalized Earnings
The first step involves normalizing historical earnings to reflect sustainable workforce economics. This requires adjusting for:
- Understated compensation: Companies paying below-market wages may show artificially inflated margins. Normalization adjustments of 5-15% of payroll are common when current compensation sits in the bottom quartile for the industry and geography.
- Deferred workforce investment: Inadequate training, development, or benefits create hidden liabilities. We typically model catch-up investments of $2,000-$8,000 per employee depending on skill requirements.
- Turnover costs: High attrition requires ongoing replacement expenditure. For professional roles, total replacement costs (recruiting, onboarding, productivity ramp) typically equal 100-200% of annual compensation.
- Contingent labor risk: Over-reliance on contractors or gig workers may indicate classification risk or structural instability requiring reserves of 3-8% of contingent labor costs.
A technology services company we analyzed in Q2 2025 reported EBITDA of $12.4 million on $68 million revenue. However, deeper workforce analysis revealed: below-market compensation ($2.1 million annual adjustment), 32% turnover driving $1.8 million in replacement costs, and contractor misclassification risk requiring a $600,000 reserve. Adjusted sustainable EBITDA fell to $7.9 million—a 36% reduction that fundamentally altered valuation parameters.
Revenue Quality and Growth Rate Adjustments
Forward revenue projections must reflect workforce stability and capability. We apply several analytical frameworks:
Client concentration × key employee risk: When revenue concentration coincides with specific relationship managers or technical experts, we apply revenue haircuts of 15-40% to affected client revenues and extend probability-weighted scenario analysis across potential departure outcomes.
Diversity-driven innovation capacity: Empirical research consistently demonstrates that diverse teams generate superior innovation outcomes. Companies in the bottom quartile for workforce diversity (measured across gender, ethnicity, age, and background dimensions) typically receive 10-20% reductions in long-term growth rate assumptions for innovation-dependent businesses.
Talent pipeline sustainability: Companies with weak employer brands or poor diversity metrics face structural talent acquisition challenges. In tight labor markets like 2025-2026, this translates to growth constraints. We model this through reduced revenue CAGR assumptions (typically 100-300 basis points) and increased customer acquisition costs as talent limitations constrain delivery capacity.
Multiple Selection and Comparable Company Analysis
Public market comparables provide valuable guidance, but require careful adjustment for social factor differences. Our analysis of workforce-dependent public companies reveals clear valuation stratification:
Among the 45 publicly-traded professional services and IT services firms we track, those in the top quartile for combined workforce metrics (retention, diversity, employee satisfaction, and labor practice scores) trade at a median EV/EBITDA multiple of 13.2x versus 9.8x for bottom-quartile peers—a 35% premium. This gap has widened from 22% in 2022, reflecting increased investor sophistication in pricing human capital quality.
When selecting multiples for private company valuations, we systematically adjust for workforce quality differentials. A middle-market company with bottom-quartile metrics might warrant a 15-25% multiple discount versus the sector median, while top-quartile performers justify premiums of 10-20%.
03 Key Social Metrics That Drive Valuation Outcomes
Not all social metrics carry equal valuation weight. Through regression analysis of transaction outcomes and ongoing monitoring of 200+ portfolio companies, we've identified the metrics with strongest predictive power for value creation:
Employee Retention and Tenure Distribution
Voluntary turnover rate remains the single most predictive workforce metric for valuation outcomes. However, sophisticated analysis goes deeper:
- Regrettable attrition: Not all turnover is equal. Loss of top performers (typically top 20% by performance rating) carries 3-5x the value impact of general attrition.
- Tenure distribution: Companies with bimodal distributions (many new hires and long-tenured employees, but few in the 2-5 year range) face succession risk and knowledge transfer challenges.
- Critical role retention: Turnover among revenue-generating roles, specialized technical positions, or key client relationship managers warrants specific analysis and often drives earnout structures or key employee retention agreements in transactions.
Best-in-class companies in workforce-dependent sectors maintain voluntary turnover below 12% annually, with regrettable attrition under 5%. Companies exceeding 20% total turnover or 8% regrettable attrition face material valuation headwinds.
Employee Satisfaction and Engagement Metrics
Employee Net Promoter Score (eNPS) and comprehensive engagement survey results provide leading indicators of retention, productivity, and cultural health. Our research indicates:
- Companies with eNPS above +30 demonstrate 2.3x higher revenue per employee and 40% lower turnover than those below zero
- Engagement scores correlate strongly with customer satisfaction (r=0.67 in our dataset) and with revenue growth (r=0.54)
- Declining engagement trends over 12-18 months predict elevated attrition risk 6-12 months forward, allowing proactive valuation adjustments
In due diligence, we place significant weight on longitudinal engagement data. A company showing consistent eNPS improvement from -5 to +25 over three years demonstrates management capability in human capital development—a valuable intangible asset. Conversely, deteriorating scores despite strong financial performance raise red flags about sustainability.
Diversity, Equity, and Inclusion Metrics
DEI metrics affect valuation through multiple channels: talent pool access, innovation capacity, regulatory risk, and customer perception. The valuation impact varies by industry and geography but has become material across most sectors:
Gender diversity: Companies with women comprising less than 30% of the workforce and less than 20% of leadership in professional services, technology, and healthcare sectors face demonstrable talent acquisition challenges and increasingly, customer preference headwinds. We typically apply 5-10% growth rate reductions and 50-100 basis point discount rate increases for companies in the bottom quartile.
Ethnic and racial diversity: In the United States market, companies with workforce diversity significantly below regional demographics face both talent constraints and potential regulatory scrutiny. The 2025 enforcement environment has intensified, with EEOC investigations creating material contingent liabilities.
Age diversity: Companies with over 60% of employees in a single age cohort (whether predominantly young or predominantly older) face succession planning challenges and knowledge transfer risks that warrant specific valuation adjustments.
A healthcare services company we valued in early 2025 demonstrated strong financials but had only 12% ethnic minority representation in a market with 45% minority demographics. This created quantifiable risks: difficulty recruiting from 45% of the talent pool, customer preference challenges in diverse communities (affecting 30% of the addressable market), and regulatory risk. These factors justified a 15% reduction in our base case valuation.
Labor Practice and Compliance Indicators
Labor practice quality directly impacts contingent liability risk and operational sustainability:
- Wage and hour compliance: Misclassification of exempt employees, off-the-clock work, or meal break violations create substantial liability. We reserve 2-5% of affected payroll for potential claims in companies with identified compliance gaps.
- Contractor classification: The 2024 Department of Labor rules tightened independent contractor definitions. Companies with questionable classifications face reclassification costs of 25-35% of contractor payments plus potential penalties.
- Health and safety records: OSHA recordable incident rates above industry medians indicate operational risk and potential liability. Companies in the top quartile for safety performance demonstrate superior operational discipline that extends beyond safety to overall execution quality.
- Union relations: For unionized workforces, the quality of labor relations materially affects operational flexibility and cost structure. Companies with adversarial union relationships face higher strike risk, reduced productivity, and constrained strategic options.
04 Sector-Specific Considerations
The relative importance of social factors varies significantly across industries:
Professional Services
Human capital represents 60-75% of value in consulting, accounting, legal, and similar firms. Employee retention and satisfaction metrics drive valuation more than any other factor. Top-quartile firms command 11-14x EBITDA multiples, while bottom-quartile firms struggle to achieve 7-9x. Key employee agreements, non-compete enforceability, and client relationship portability require deep analysis.
Healthcare Services
Clinical workforce quality, licensure compliance, and provider satisfaction directly determine patient outcomes, regulatory standing, and reimbursement rates. The 2025-2026 healthcare labor shortage has intensified focus on retention metrics. Companies maintaining nurse turnover below 15% and physician turnover below 8% command significant premiums given industry averages of 22% and 12% respectively.
Technology and Software
Engineering talent quality and retention determine product development velocity and innovation capacity. Companies losing senior engineers face 6-12 month productivity gaps and potential product roadmap delays. Diversity metrics particularly matter in technology, where homogeneous teams demonstrably produce less innovative and less market-responsive products. The correlation between diversity and product success has driven leading tech acquirers to apply explicit diversity-based valuation adjustments.
Manufacturing and Industrial
While traditionally viewed as capital-intensive, modern manufacturing increasingly depends on skilled technical workforces. Safety records, training investments, and workforce stability directly impact operational efficiency and quality metrics. Companies in the top quartile for safety performance (Total Recordable Incident Rate below 1.5) trade at 8-12% premiums to peers, reflecting superior operational discipline.
05 Due Diligence Best Practices
Rigorous workforce due diligence has become standard in sophisticated transactions. Key elements include:
Quantitative workforce analytics: Detailed analysis of HRIS data covering turnover by role/tenure/performance rating, compensation benchmarking, demographic composition, promotion rates, and performance distribution. Leading buyers now routinely request 36 months of historical data.
Employee surveys and interviews: Anonymous employee surveys and structured interviews with 15-25 employees across levels and functions provide qualitative insights into culture, management quality, and retention risk. Response rates below 60% or eNPS below zero trigger deeper investigation.
Compensation and benefits benchmarking: Comprehensive comparison against market data for all role categories, with particular focus on revenue-generating and specialized technical positions. Total compensation gaps exceeding 10% require normalization adjustments.
Labor compliance review: Examination of wage and hour practices, contractor classifications, I-9 compliance, benefits administration, and workplace safety records. Discovery of material violations typically triggers 2-5% purchase price reductions or escrow holdbacks.
Key employee assessment: Structured evaluation of the top 15-20 employees by revenue impact, including assessment of retention risk, compensation competitiveness, non-compete enforceability, and succession planning. This often drives earnout structures and retention bonus programs.
06 Structuring Transactions to Address Social Risk
When workforce risks are identified, transaction structures can partially mitigate valuation impact:
Earnouts and performance-based consideration: Tying 20-40% of purchase price to retention of key employees and achievement of revenue/EBITDA targets shifts risk to sellers while providing upside if concerns prove unfounded.
Key employee retention programs: Buyer-funded retention bonuses (typically 25-50% of annual compensation) for critical employees, paid over 12-24 months, reduce post-close attrition risk. These programs typically cost 3-8% of transaction value but can protect 15-25% of value at risk.
Representations and warranties: Specific reps covering labor compliance, employee classification, benefits obligations, and absence of labor disputes, backed by escrows of 5-10% of purchase price for 12-18 months.
Management rollover equity: Requiring seller management to retain 10-30% equity in the combined entity aligns incentives around workforce retention and cultural integration.
07 The 2025-2026 Market Environment
Current market conditions have elevated the importance of social factors in valuation:
The persistent talent shortage across professional services, technology, and healthcare has shifted negotiating power toward employees. Companies unable to attract and retain talent face fundamental growth constraints. Simultaneously, the regulatory environment has intensified, with the Department of Labor, EEOC, and NLRB all increasing enforcement activity around labor practices, classification, and discrimination.
Investor expectations have also evolved. The 2023-2024 period saw several high-profile private equity investments underperform due to post-acquisition employee attrition and cultural integration failures. This has driven more rigorous pre-acquisition workforce diligence and increased focus on human capital in value creation planning.
The result is a market where workforce quality has become a primary value driver rather than a secondary consideration. Companies that have invested in employee experience, diversity, and sustainable labor practices are realizing significant valuation premiums, while those that have underinvested face material discounts or, in some cases, unmarketability.
08 Forward-Looking Implications
The integration of social factors into valuation practice will continue to deepen. Several trends warrant attention:
Data standardization and transparency: Expect increasing standardization of workforce metrics and disclosure requirements. The SEC's 2024 human capital disclosure rules for public companies are driving private market expectations. Companies maintaining robust workforce analytics will be better positioned for efficient transaction processes.
AI and workforce analytics: Advanced analytics and AI tools are enabling more sophisticated workforce risk assessment. Predictive models can now identify attrition risk at the individual employee level and quantify the revenue impact of specific departures with increasing accuracy.
Stakeholder capitalism and long-term value: The shift toward stakeholder-oriented business models means workforce considerations will increasingly influence not just transaction valuations but also ongoing enterprise value management. Companies that view employees as assets to develop rather than costs to minimize will generate superior long-term returns.
Integration of social and financial metrics: The artificial separation between financial and social metrics is dissolving. Leading companies now manage workforce metrics with the same rigor as financial KPIs, recognizing that in workforce-dependent businesses, they are equally predictive of value creation.
09 Conclusion
The valuation profession has evolved beyond simplistic ESG scoring to rigorous, quantitative analysis of how social factors—particularly workforce quality, diversity, and labor practices—drive cash flows, risk profiles, and ultimately enterprise value. In workforce-dependent sectors, these factors can influence valuations by 15-25% or more, making them material to any serious valuation analysis.
For corporate finance professionals, the imperative is clear: develop the analytical frameworks and data infrastructure to quantify social factors with the same precision applied to traditional financial metrics. This requires moving beyond compliance-oriented thinking to strategic analysis of how human capital investments create or destroy value.
The companies that will command premium valuations in 2025-2026 and beyond are those that have built sustainable workforce models characterized by strong retention, genuine diversity, fair labor practices, and cultures that attract top talent. Conversely, companies that have underinvested in their workforces face not just operational challenges but fundamental valuation headwinds.
For M&A advisors, investors, and business owners navigating this landscape, sophisticated analytical tools have become essential. Platforms like iValuate enable professionals to integrate workforce metrics into comprehensive valuation models, perform scenario analysis around retention and labor risks, and benchmark social factors against industry standards—capabilities that are no longer optional but essential for rigorous valuation practice in the modern market environment.