Table of Contents8 sections
The venture capital landscape for SaaS startups has undergone a fundamental recalibration since the market correction of 2022-2023. As we navigate 2025-2026, investors have become increasingly disciplined, focusing on a core set of operational metrics that directly correlate with sustainable growth and capital efficiency. Gone are the days when revenue growth alone commanded premium valuations. Today's SaaS valuations are driven by a sophisticated interplay of metrics that demonstrate not just growth, but profitable, efficient, and durable growth.
For founders seeking capital and investors conducting due diligence, understanding these metrics—and more importantly, the benchmarks that separate exceptional companies from mediocre ones—has become mission-critical. This article examines the four foundational SaaS metrics that drive valuations in today's market: Annual Recurring Revenue (ARR), Net Dollar Retention (NDR), Customer Acquisition Cost (CAC) Payback Period, and the Lifetime Value to Customer Acquisition Cost (LTV/CAC) ratio.
01 Annual Recurring Revenue: The Foundation of SaaS Valuation
Annual Recurring Revenue remains the primary top-line metric for SaaS company valuation, but its role has evolved significantly. ARR represents the annualized value of recurring subscription revenue, normalized to a one-year period. While seemingly straightforward, ARR calculation requires careful consideration of what constitutes truly recurring revenue versus one-time fees, professional services, or usage-based components.
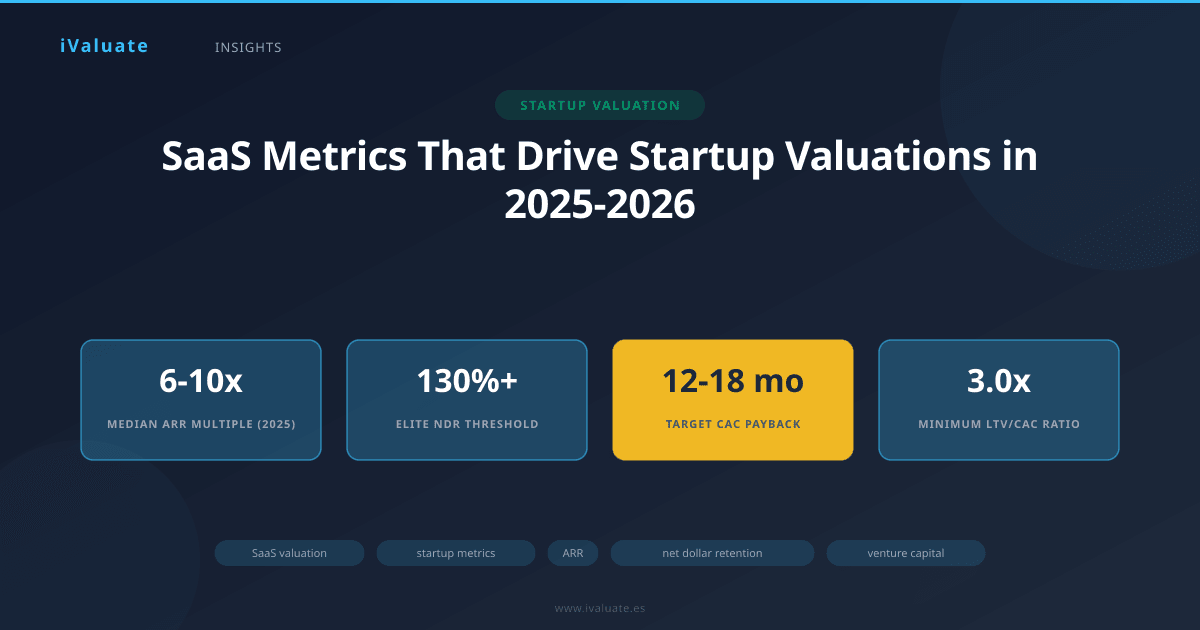
In the current market environment, ARR serves as the baseline for revenue multiple valuation methodologies. As of early 2025, median ARR multiples for private SaaS companies have stabilized in the 6-10x range for growth-stage companies, a significant compression from the 15-25x multiples common in 2021. However, this aggregate figure masks substantial variation based on growth rates and efficiency metrics.
ARR Growth Rate Benchmarks
The velocity of ARR growth remains a critical valuation driver, but investors now scrutinize the quality and sustainability of that growth more carefully. The "Rule of 40"—where growth rate plus profit margin should exceed 40%—has evolved into a more nuanced framework. Companies demonstrating 100%+ year-over-year ARR growth while maintaining reasonable burn multiples (net burn divided by net new ARR) command premium valuations, often in the 12-15x ARR range even in today's market.
For context, a Series B SaaS company growing from $5 million to $12 million ARR (140% growth) with a burn multiple under 2x would likely achieve a valuation in the $120-180 million range, assuming strong performance on other key metrics. Conversely, a company growing 40% annually from $20 million to $28 million ARR might achieve only a 7-8x multiple, resulting in a $160-224 million valuation despite higher absolute ARR.
The market has shifted from rewarding growth at any cost to rewarding efficient growth. A company growing 60% annually with positive unit economics will often command higher multiples than one growing 100% while burning unsustainably.
ARR Composition and Quality
Sophisticated investors now dissect ARR composition with forensic precision. Key considerations include:
- Contract duration: Multi-year contracts with annual payment terms provide more predictable cash flow than month-to-month arrangements
- Customer concentration: ARR derived from hundreds of small customers is valued differently than ARR concentrated in ten enterprise accounts
- Expansion revenue: ARR growth driven by existing customer expansion (measured through NDR) is valued more highly than new customer acquisition alone
- Churn-adjusted ARR: Gross ARR growth figures can mask underlying retention issues that become apparent in net revenue retention analysis
A real-world example illustrates this principle: In 2024, a vertical SaaS company serving the healthcare sector achieved a 14x ARR multiple at its Series C despite "only" 65% year-over-year growth. The premium valuation reflected ARR composition—98% from annual or multi-year contracts, 130% NDR, and zero customer concentration above 3% of total ARR. The quality of the revenue base justified the multiple expansion.
02 Net Dollar Retention: The Ultimate Efficiency Metric
Net Dollar Retention has emerged as perhaps the single most important metric for SaaS valuation in 2025-2026. NDR measures the percentage of revenue retained from existing customers over a period, including expansions, upsells, and cross-sells, but net of downgrades and churn. A 120% NDR means that a cohort of customers who represented $100 in ARR one year ago now represents $120 in ARR, even without any new customer acquisition.
The power of NDR lies in what it reveals about product-market fit, customer satisfaction, and organic growth potential. Companies with NDR above 120% can grow significantly even with zero new customer acquisition—a characteristic that dramatically reduces business risk and capital requirements.
NDR Benchmarks and Valuation Impact
Current market benchmarks for NDR vary by company stage and market segment:
- Elite tier (130%+ NDR): Reserved for companies with exceptional product stickiness and expansion mechanisms. These companies often command 15-20% valuation premiums over peers with similar ARR growth
- Strong tier (115-130% NDR): Indicates healthy customer relationships and effective expansion motion. This range has become the new baseline expectation for venture-scale SaaS companies
- Acceptable tier (100-115% NDR): Suggests the company retains customers but lacks strong expansion dynamics. Valuations typically apply 10-20% discounts in this range
- Concerning tier (below 100% NDR): Indicates net revenue churn, a significant red flag that can reduce valuations by 30-50% or make companies uninvestable for growth equity
The mathematical impact of NDR on long-term value creation is profound. Consider two companies, each starting with $10 million ARR and adding $5 million in new ARR annually. Company A has 120% NDR; Company B has 100% NDR. After five years, Company A reaches $86 million ARR while Company B reaches only $60 million ARR—a 43% difference driven entirely by retention and expansion dynamics.
Decomposing NDR: Gross Retention and Expansion
Sophisticated investors decompose NDR into its constituent parts: Gross Dollar Retention (GDR) and expansion rate. GDR measures revenue retention before any upsells or expansions—essentially, what percentage of last year's revenue remains if no customer expanded their spend. The expansion rate captures upsells, cross-sells, and usage-based growth.
A company with 95% GDR and 25% expansion achieves 120% NDR, but this profile differs fundamentally from one with 105% GDR (meaning customers actually expand without any sales intervention) and 15% expansion. The latter suggests stronger product-market fit and potentially more durable retention.
In a notable 2024 transaction, a marketing automation SaaS company achieved a $400 million valuation on $35 million ARR (11.4x multiple) despite only 55% year-over-year growth. The valuation premium stemmed from 138% NDR, decomposed into 98% GDR and 40% expansion rate. Investors recognized that the company's growth was increasingly self-sustaining, reducing future capital requirements and de-risking the investment.
03 CAC Payback Period: The Efficiency Gatekeeper
Customer Acquisition Cost Payback Period measures how many months of revenue are required to recover the fully-loaded cost of acquiring a customer. This metric has become a critical gatekeeper for venture funding in 2025-2026, as investors demand proof of efficient growth before deploying capital at scale.
CAC Payback is calculated by dividing the fully-loaded CAC (including all sales and marketing expenses) by the monthly recurring revenue from new customers, adjusted for gross margin. A 12-month payback means that after one year, the gross profit from a new customer has fully recovered the acquisition cost.
Current Market Benchmarks
CAC Payback benchmarks vary significantly by go-to-market motion and average contract value:
- Product-led growth (PLG) companies: 6-12 months is considered excellent, as these companies typically have lower CAC and faster payback cycles
- Inside sales motion (ACV $10K-50K): 12-18 months represents strong efficiency, with 18-24 months being acceptable
- Enterprise sales (ACV $100K+): 18-24 months is the target range, with payback periods up to 30 months acceptable if LTV metrics are exceptional
Companies demonstrating CAC Payback under 12 months often command valuation premiums of 20-30% compared to peers with 18-24 month payback periods, all else being equal. The reason is straightforward: faster payback means the company can reinvest capital more quickly, creating a compounding growth advantage.
In today's capital-efficient environment, a SaaS company with 12-month CAC Payback growing 70% annually will often receive higher valuations than one with 24-month payback growing 90% annually. The former demonstrates a more sustainable, capital-efficient growth engine.
The Relationship Between CAC Payback and Growth
One of the most sophisticated analyses investors perform involves plotting CAC Payback against growth rate to assess whether a company is optimally investing in growth. Companies with very short payback periods (under 9 months) but modest growth rates (under 50%) may be underinvesting in sales and marketing, leaving growth on the table. Conversely, companies with extended payback periods (over 30 months) and high growth may be buying revenue unsustainably.
The optimal zone for venture-scale companies typically involves 12-18 month payback periods coupled with 60-100%+ growth rates. This combination suggests the company has discovered efficient acquisition channels and is scaling them aggressively but sustainably.
A practical example: In early 2025, a cybersecurity SaaS company raised a Series B at a $180 million valuation on $15 million ARR (12x multiple). The company was growing 85% annually with a 14-month CAC Payback period. Investors modeled that the company could maintain 70%+ growth for the next three years while achieving Rule of 40 compliance within 18 months—a trajectory made possible by the efficient payback dynamics.
04 LTV/CAC Ratio: The Long-Term Value Indicator
The Lifetime Value to Customer Acquisition Cost ratio provides a comprehensive view of long-term unit economics. LTV represents the total gross profit expected from a customer over their entire relationship with the company, while CAC captures the fully-loaded acquisition cost. The LTV/CAC ratio indicates how much value is created for each dollar spent on acquisition.
Calculating LTV in SaaS
LTV calculation requires three inputs: average revenue per account (ARPA), gross margin percentage, and customer lifetime (typically calculated as 1 divided by monthly churn rate). The formula is:
LTV = (ARPA × Gross Margin %) / Monthly Churn Rate
For example, a company with $2,000 monthly ARPA, 80% gross margins, and 2% monthly churn would have an LTV of $80,000. If the CAC for this customer segment is $20,000, the LTV/CAC ratio is 4.0x.
Benchmark Standards and Valuation Implications
The venture capital industry has coalesced around the following LTV/CAC benchmarks:
- 3.0x or higher: Considered the minimum threshold for venture-scale SaaS businesses. Ratios in the 3-5x range indicate healthy unit economics
- 5.0x to 7.0x: Exceptional unit economics that justify aggressive growth investment. Companies in this range often receive premium valuations
- Above 7.0x: May indicate underinvestment in growth or overly conservative CAC allocation. Investors may push for more aggressive scaling
- Below 3.0x: Signals concerning unit economics that may make the business uninvestable without a clear path to improvement
The relationship between LTV/CAC and valuation multiples is non-linear. Companies with 5.0x+ LTV/CAC ratios often command 25-40% higher ARR multiples than those with 3.0-4.0x ratios, even at similar growth rates. The reason is that higher LTV/CAC provides more strategic flexibility—the company can choose to invest aggressively in growth, harvest profits, or balance both objectives.
The Interplay of Payback and LTV/CAC
Sophisticated investors analyze CAC Payback and LTV/CAC in tandem, as they reveal different aspects of unit economics. A company might have a 6.0x LTV/CAC ratio (excellent) but a 30-month payback period (concerning). This profile suggests strong long-term economics but significant upfront capital requirements and risk if churn increases.
Conversely, a 10-month payback with a 3.5x LTV/CAC indicates fast capital recovery but modest long-term value creation per customer. This profile might be optimal for a bootstrapped company but less attractive for venture investors seeking exponential returns.
The ideal profile combines 12-18 month payback with 5.0x+ LTV/CAC—fast enough capital recovery to enable aggressive scaling, with sufficient long-term value to justify the investment. Companies achieving this combination in 2025-2026 are receiving valuations 30-50% above market medians.
05 How These Metrics Interact in Valuation Models
While each metric provides valuable insights independently, their true power emerges in how they interact within comprehensive valuation models. Investors construct scenarios that project future ARR based on assumptions about new customer acquisition, NDR, and the capital required to fuel growth (driven by CAC Payback and LTV/CAC).
The Efficient Growth Framework
Leading venture firms have adopted variations of an "Efficient Growth Score" that combines these metrics into a composite indicator. One common framework assigns weights as follows:
- ARR Growth Rate: 30% weight
- Net Dollar Retention: 30% weight
- CAC Payback Period: 20% weight
- LTV/CAC Ratio: 20% weight
Companies scoring in the top quartile across all four dimensions command premium valuations, often 12-15x ARR even in the current market. Those with mixed performance—perhaps exceptional NDR but concerning CAC Payback—receive valuations that reflect the specific risk-return profile.
Case Study: Contrasting Valuation Outcomes
Consider two hypothetical Series B companies, both with $20 million ARR, evaluated in Q1 2025:
Company Alpha:
- ARR Growth: 120% YoY
- NDR: 108%
- CAC Payback: 26 months
- LTV/CAC: 3.2x
Company Beta:
- ARR Growth: 75% YoY
- NDR: 128%
- CAC Payback: 13 months
- LTV/CAC: 5.8x
Despite Company Alpha's higher growth rate, Company Beta received a higher valuation—$240 million versus $200 million. Investors recognized that Beta's superior efficiency metrics indicated more sustainable, capital-efficient growth. Beta's 128% NDR meant that 53% of its growth was organic (from existing customers), while Alpha's 108% NDR meant only 8% was organic. Beta's 13-month payback enabled rapid capital recycling, while Alpha's 26-month payback created significant cash consumption.
Projecting forward three years, investors modeled that Beta would reach $180 million ARR with $40 million in cumulative capital consumption, while Alpha would reach $220 million ARR but consume $90 million in capital. On a capital-adjusted basis, Beta's path created more shareholder value despite lower absolute growth.
06 Emerging Trends and Future Considerations
As we progress through 2025-2026, several trends are reshaping how these metrics influence valuations:
The Rise of Profitability-Adjusted Metrics
Investors increasingly evaluate metrics through a profitability lens. "NDR at what burn multiple?" and "Growth rate at what free cash flow margin?" have become standard questions. Companies demonstrating strong metrics while approaching or achieving positive free cash flow command significant premiums—often 40-60% above peers with similar metrics but ongoing cash consumption.
Cohort-Level Analysis
Rather than accepting company-wide averages, investors now demand cohort-level visibility into all key metrics. A company might report 120% NDR overall, but if recent cohorts show declining retention (perhaps 105% NDR for the 2024 cohort versus 135% for 2022), this trend significantly impacts valuation. Similarly, CAC Payback analysis by cohort reveals whether unit economics are improving or deteriorating as the company scales.
Product-Led Growth Dynamics
PLG companies exhibit different metric profiles than traditional enterprise SaaS businesses. PLG companies often show lower initial ARPA but faster payback periods, higher NDR driven by viral expansion, and different LTV/CAC dynamics. Investors have developed specialized frameworks for evaluating PLG metrics, often placing greater weight on activation rates, product-qualified leads (PQLs), and time-to-value metrics alongside traditional SaaS KPIs.
07 Practical Implications for Founders and Investors
For founders preparing to raise capital, understanding these metrics and their benchmarks is essential for successful fundraising. Companies should focus on:
- Metric transparency: Provide detailed breakdowns of ARR composition, NDR by cohort, and fully-loaded CAC calculations. Investors will discover any issues during due diligence; proactive disclosure builds credibility
- Trend demonstration: Show quarter-over-quarter improvement in efficiency metrics. A company with 20-month CAC Payback improving to 16 months tells a more compelling story than one stuck at 14 months
- Benchmark awareness: Understand where your metrics rank relative to industry standards and be prepared to explain any outliers
- Strategic narrative: Connect metric performance to strategic decisions. If NDR is lower than ideal, explain the product roadmap initiatives designed to drive expansion
For investors conducting due diligence, these metrics provide a framework for comparative analysis and risk assessment. However, metrics should inform rather than replace judgment. A company with mediocre metrics but exceptional market opportunity and team quality may warrant investment, while one with strong metrics in a declining market may not.
08 Conclusion: The Path Forward
The SaaS valuation landscape of 2025-2026 rewards companies that demonstrate not just growth, but efficient, sustainable, and profitable growth. ARR remains the foundation, but Net Dollar Retention, CAC Payback Period, and LTV/CAC ratio have become equally critical in determining valuations. Companies that excel across all four dimensions—growing rapidly while retaining and expanding customers efficiently—command premium valuations even in a more disciplined capital environment.
The market correction of recent years has ultimately strengthened the SaaS ecosystem by refocusing attention on fundamental business quality. Companies built on strong unit economics and efficient growth engines are better positioned for long-term success than those that prioritized growth at any cost.
For professionals navigating this landscape—whether raising capital, conducting valuations, or making investment decisions—mastering these metrics and their interrelationships is essential. Modern valuation platforms like iValuate have emerged to help professionals perform sophisticated analyses of these metrics, enabling more informed decision-making in an increasingly complex market. As the SaaS industry continues to mature, the companies and investors who best understand and optimize these core metrics will be best positioned to create and capture value in the years ahead.