Table of Contents10 sections
In the technology sector, particularly for Software-as-a-Service (SaaS) companies, traditional earnings-based valuation metrics often prove inadequate or entirely inapplicable. Many high-growth tech companies operate at a loss for years while building market share, developing products, and scaling operations. For these businesses, revenue multiples—specifically Enterprise Value-to-Revenue (EV/Revenue) ratios—have become the dominant valuation framework. Understanding these multiples, their drivers, and current market benchmarks is essential for anyone involved in tech company valuation, M&A advisory, or investment decisions.
01 Why Revenue Multiples Dominate Tech Valuations
The prevalence of revenue-based valuation in the technology sector stems from fundamental characteristics of software business models. Unlike traditional businesses where profitability serves as a reliable indicator of value creation, SaaS companies deliberately sacrifice near-term profitability to capture market share and achieve scale economies that will drive future margins.
Consider that as of Q1 2025, approximately 43% of publicly traded SaaS companies with revenues exceeding $100 million remain unprofitable on a GAAP basis. For these businesses, EBITDA multiples are either negative (and thus meaningless) or artificially inflated due to minimal positive EBITDA. Revenue multiples provide a consistent, comparable metric across profitable and unprofitable companies alike.
The EV/Revenue multiple offers several distinct advantages for tech company valuation:
- Universal applicability: Every company generates revenue (or ARR), making cross-company comparisons possible regardless of profitability status
- Growth visibility: Revenue growth rates are less subject to accounting manipulation than earnings metrics
- Strategic value capture: Revenue multiples better reflect the strategic value of customer relationships, recurring revenue streams, and market position
- Forward-looking orientation: Investors price tech companies based on future profit potential, which revenue growth helps predict
The shift toward revenue multiples reflects a fundamental truth about software economics: today's revenue growth, combined with strong unit economics, reliably predicts tomorrow's profitability at scale.
02 Current Market Benchmarks: 2025-2026 Landscape
The SaaS valuation environment has undergone significant recalibration since the exuberant peaks of 2020-2021. During that period, median public SaaS companies traded at EV/Revenue multiples exceeding 15x, with high-growth companies commanding 25x-30x or higher. The subsequent correction brought multiples back to historical norms, though with important segmentation based on company characteristics.
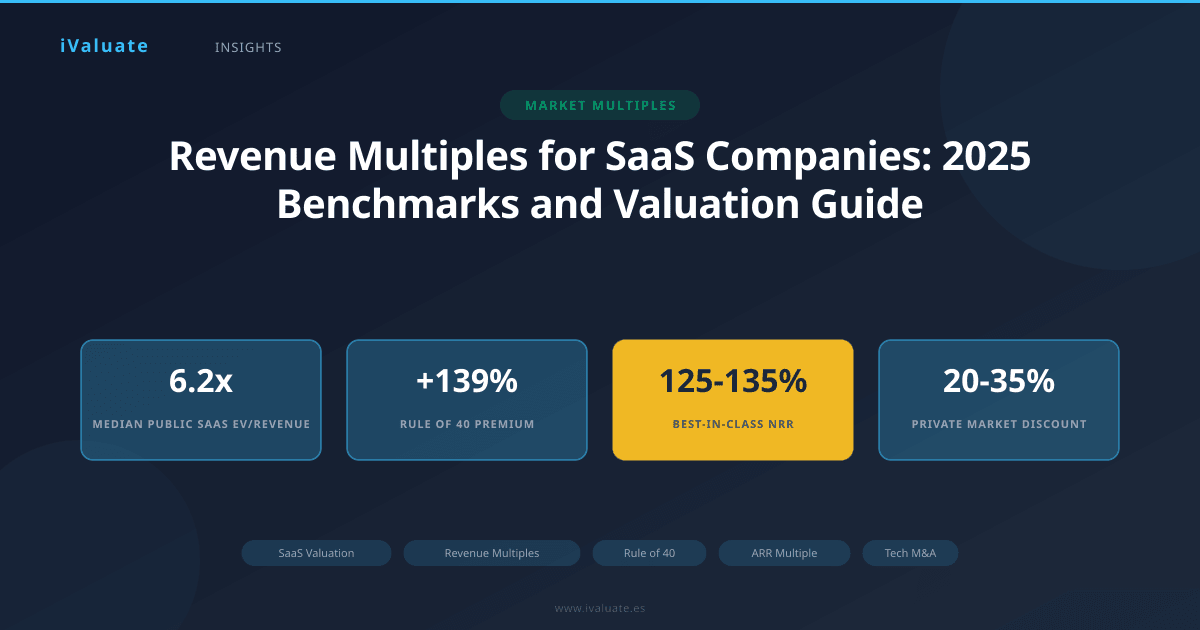
As of early 2025, the median EV/Revenue multiple for public SaaS companies stands at approximately 6.2x, representing a stabilization after the 2022-2023 downturn. However, this median masks substantial variation:
- High-growth leaders (>40% YoY growth): 10x-15x EV/Revenue
- Quality growth (25-40% YoY growth): 7x-10x EV/Revenue
- Moderate growth (15-25% YoY growth): 4x-7x EV/Revenue
- Slower growth (<15% YoY growth): 2x-4x EV/Revenue
These ranges reflect companies with strong underlying metrics. Companies with inferior retention rates, weak gross margins, or concerning customer concentration typically trade at 30-50% discounts to these benchmarks.
The ARR Multiple Framework
For private SaaS companies, Annual Recurring Revenue (ARR) multiples have become the standard valuation metric. ARR represents the annualized value of recurring subscription contracts and provides a cleaner measure of sustainable revenue than total revenue, which may include one-time services or implementation fees.
Private market ARR multiples generally track public market EV/Revenue multiples but with a liquidity discount of 20-35%. In the current environment, private SaaS companies typically command:
- Exceptional companies (>50% growth, strong Rule of 40): 8x-12x ARR
- Strong performers (30-50% growth): 5x-8x ARR
- Solid businesses (20-30% growth): 3x-5x ARR
- Mature/slower growth (<20% growth): 2x-3x ARR
A concrete example illustrates these dynamics: In late 2024, a vertical SaaS company serving the healthcare sector with $25 million in ARR, 45% year-over-year growth, 82% gross margins, and 115% net revenue retention was acquired at 9.2x ARR. The premium multiple reflected not just growth, but the quality of that growth—high retention, expanding customer relationships, and strong unit economics pointing toward future profitability.
03 The Rule of 40: Balancing Growth and Profitability
While revenue multiples provide the valuation framework, the Rule of 40 has emerged as the critical metric for assessing SaaS company quality and justifying premium valuations. The Rule of 40 states that a company's growth rate plus its profit margin should exceed 40%.
For example:
- Company A: 50% revenue growth + (-10%) EBITDA margin = 40% (meets threshold)
- Company B: 25% revenue growth + 20% EBITDA margin = 45% (exceeds threshold)
- Company C: 30% revenue growth + (-5%) EBITDA margin = 25% (below threshold)
Analysis of public SaaS companies in 2025 reveals a strong correlation between Rule of 40 performance and valuation multiples. Companies exceeding 50% on the Rule of 40 metric trade at median multiples of 9.8x revenue, while those below 30% trade at just 4.1x revenue—a 139% premium for superior efficiency.
The Rule of 40 matters because it captures the fundamental trade-off in SaaS business models. High-growth companies can justify losses because they're investing in future value. But there's a limit—burning cash without corresponding growth destroys value. Conversely, profitable but slow-growing companies may be underinvesting in their future. The Rule of 40 identifies companies that have achieved the optimal balance.
In today's market, exceeding the Rule of 40 threshold represents table stakes for premium valuations. The companies commanding 10x+ revenue multiples typically score 60% or higher, demonstrating both exceptional growth and a clear path to profitability.
Calculating Profit Margin for the Rule of 40
A technical but important consideration: which profit metric should be used? Market practice has converged on Free Cash Flow (FCF) margin as the preferred metric for public companies, as it reflects actual cash generation. For private companies, EBITDA margin is more commonly used due to data availability and comparability.
The formula becomes:
Rule of 40 Score = Revenue Growth Rate (%) + FCF Margin (%)
Some practitioners adjust for stock-based compensation when calculating FCF, arguing it represents real economic dilution. This adjustment typically reduces the Rule of 40 score by 5-15 percentage points for high-growth companies with aggressive equity compensation programs.
04 Key Drivers of Revenue Multiple Variation
While growth rate and Rule of 40 performance explain much of the variation in revenue multiples, several other factors significantly impact valuations:
1. Net Revenue Retention (NRR)
NRR measures the percentage of revenue retained from existing customers, including expansions and upgrades but accounting for churn and downgrades. Companies with NRR above 120% command substantial premiums—often 40-60% higher multiples than peers with 100-110% NRR.
The logic is straightforward: if you retain and expand 120% of last year's revenue, you only need to acquire new customers to drive incremental growth. This dramatically improves unit economics and reduces customer acquisition costs as a percentage of revenue over time. In 2025, best-in-class SaaS companies are achieving NRR of 125-135%, with some infrastructure software companies exceeding 140%.
2. Gross Margin Profile
Software companies should exhibit gross margins of 70-85% or higher. Companies below 70% face questions about their business model—are they actually software companies or services businesses with a software component? Those exceeding 80% demonstrate true software economics with minimal variable costs.
A 10-percentage-point difference in gross margin can justify a 15-25% difference in revenue multiple, all else equal. This reflects the direct impact on long-term profitability potential and operating leverage.
3. Customer Concentration and Market Position
Companies where the top 10 customers represent more than 30-40% of revenue face meaningful valuation discounts, typically 20-30% below comparable peers. This concentration risk introduces revenue volatility and negotiating leverage concerns.
Conversely, companies with strong market positions—particularly those ranked #1 or #2 in their category—command premium multiples. Market leadership suggests pricing power, customer stickiness, and the ability to capture disproportionate value as the category grows.
4. Sales Efficiency and CAC Payback
The Customer Acquisition Cost (CAC) payback period measures how many months of gross profit are required to recover the cost of acquiring a customer. Best-in-class SaaS companies achieve payback in 12-18 months, while 24-36 months is acceptable for complex enterprise sales.
Companies with sub-12-month payback periods demonstrate exceptional sales efficiency and can grow rapidly without consuming excessive capital. These businesses often trade at 30-50% premiums to peers with longer payback periods, reflecting their capital-light growth profile.
05 Sector-Specific Considerations
Revenue multiples vary significantly across technology subsectors based on growth expectations, competitive dynamics, and business model characteristics:
Infrastructure and DevOps Software: These companies typically command the highest multiples (8x-14x revenue for public companies) due to high NRR, strong gross margins, and mission-critical positioning. Examples include observability platforms, security infrastructure, and developer tools.
Vertical SaaS: Industry-specific software companies trade at 5x-9x revenue, with premium valuations for those demonstrating payment monetization, marketplace dynamics, or embedded fintech capabilities. The embedded payments trend has been particularly transformative, with companies processing payments on behalf of customers capturing 100-200 basis points of transaction volume as incremental revenue.
Horizontal Business Applications: CRM, marketing automation, HR tech, and similar categories typically trade at 4x-8x revenue. Differentiation comes from workflow automation capabilities, AI integration, and ecosystem strength.
Consumer/SMB SaaS: These businesses face higher churn and lower expansion revenue, resulting in more modest multiples of 3x-6x revenue. Companies that successfully move upmarket or demonstrate consumer-to-enterprise crossover potential can break out of this range.
06 Real-World Valuation Example
Consider a hypothetical but representative scenario: TechCo, a cybersecurity SaaS platform, is being valued for a potential acquisition in Q1 2025. The company's metrics:
- ARR: $40 million
- Revenue growth: 55% YoY
- Gross margin: 84%
- EBITDA margin: -8%
- Rule of 40 score: 47%
- Net revenue retention: 128%
- CAC payback: 14 months
- Top 10 customer concentration: 22%
Based on comparable public company analysis, cybersecurity SaaS companies with similar growth profiles trade at 9x-11x revenue. TechCo's exceptional NRR and efficient CAC payback justify the high end of this range. However, the modest EBITDA loss (though acceptable given growth) suggests 10x as appropriate.
The valuation calculus: $40 million ARR × 10x = $400 million enterprise value. A strategic acquirer might pay 10.5x-11x ($420-$440 million) based on synergies, while a financial buyer would likely offer 8.5x-9.5x ($340-$380 million) reflecting higher return requirements and no synergies.
This example illustrates how revenue multiples, informed by underlying operational metrics, provide a structured framework for arriving at defensible valuations even for unprofitable companies.
07 The AI Impact on SaaS Valuations
The rapid advancement of artificial intelligence capabilities is reshaping SaaS valuation dynamics in 2025-2026. Companies successfully integrating AI to drive product differentiation, improve customer outcomes, or enhance operational efficiency are commanding 20-40% premiums over peers.
However, the market has become sophisticated in distinguishing genuine AI integration from superficial "AI-washing." Companies earning AI-driven premiums demonstrate:
- Measurable improvement in customer metrics (retention, expansion, satisfaction) attributable to AI features
- Proprietary data moats that improve model performance over time
- AI-driven automation that improves gross margins or sales efficiency
- Clear articulation of how AI creates defensible competitive advantages
Conversely, companies facing AI-driven disruption risk—particularly those whose core value proposition could be replicated by large language models—are experiencing multiple compression of 15-30%. This dynamic is creating significant dispersion within previously homogeneous subsectors.
08 Private vs. Public Market Dynamics
While public market multiples provide important benchmarks, private company valuations require careful adjustment. The liquidity discount for private companies typically ranges from 20-35%, though this varies based on company size, growth trajectory, and market conditions.
In the current environment (2025), the private-public gap has narrowed somewhat from the 2022-2023 period, when private companies struggled to accept the new valuation reality. Most private SaaS companies now trade at 65-80% of comparable public multiples, with larger companies ($50M+ ARR) at the high end and smaller companies at the low end of this range.
Additionally, private company valuations often incorporate specific deal dynamics:
- Strategic vs. financial buyers: Strategic acquirers typically pay 15-30% premiums for synergies
- Competitive processes: Well-run auctions can drive 10-20% premiums over bilateral negotiations
- Founder preferences: Partial sales or earn-outs may justify higher headline multiples
09 Practical Application and Tools
For CFOs, M&A advisors, and business owners navigating SaaS valuations, several practical steps enhance analytical rigor:
First, build a comprehensive comparable company set. Include 8-12 public companies with similar business models, end markets, and growth profiles. Track their multiples quarterly to understand trends and ranges.
Second, calculate and monitor the key operational metrics that drive multiples: growth rate, Rule of 40 score, NRR, gross margin, and CAC payback. These metrics tell the story behind the numbers and identify improvement opportunities.
Third, understand your company's positioning within the market landscape. Are you a category leader, fast follower, or niche player? This positioning significantly impacts the multiple you can command.
Fourth, prepare for valuation discussions by articulating your investment thesis. Why should your company trade at a premium? What specific metrics or strategic advantages justify above-median multiples?
The companies that achieve premium valuations don't just have strong metrics—they can clearly articulate why those metrics will sustain or improve, creating confidence in future value creation.
10 Looking Forward: 2025-2026 Outlook
The SaaS valuation environment in 2025-2026 appears to have found a sustainable equilibrium after the volatility of recent years. Several trends are shaping the landscape:
Quality over growth: The market increasingly rewards efficient growth over growth-at-all-costs. Companies with strong Rule of 40 scores and clear paths to profitability command premiums, while those burning cash without corresponding growth face skepticism.
AI-driven bifurcation: The gap between AI winners and losers will likely widen, creating significant multiple dispersion within subsectors previously valued similarly.
Vertical SaaS strength: Industry-specific software with embedded payments and fintech capabilities continues to attract premium valuations as these business models demonstrate superior unit economics.
IPO market normalization: As the IPO window reopens for high-quality SaaS companies, public market multiples should provide more reliable benchmarks for private valuations.
For professionals involved in tech company valuation, staying current with these evolving benchmarks and frameworks is essential. Revenue multiples will continue to dominate SaaS valuations, but the sophistication around which companies deserve premium multiples—and why—has increased substantially. Tools like iValuate help professionals efficiently analyze these metrics, build comparable company sets, and generate defensible valuations grounded in current market data.
The fundamental principle remains unchanged: revenue multiples work for tech companies because they capture the strategic value of recurring customer relationships and growth potential that traditional earnings metrics miss. Understanding the drivers behind these multiples—growth, efficiency, retention, and market position—enables more informed investment decisions, more effective M&A negotiations, and better strategic planning for building valuable software businesses.