Table of Contents9 sections
Real estate investment trusts (REITs) and property companies represent a unique valuation challenge that sits at the intersection of real estate appraisal and equity analysis. Unlike traditional operating companies valued primarily on earnings multiples, REITs require a specialized toolkit that accounts for their asset-intensive nature, regulatory requirements, and distinctive cash flow characteristics. As we navigate the 2025-2026 market environment—characterized by elevated interest rates, selective capital deployment, and divergent performance across property sectors—understanding the three foundational valuation methodologies becomes essential for investment professionals.
This article provides a comprehensive framework for valuing REITs and property companies through Net Asset Value (NAV) analysis, Funds From Operations (FFO) multiples, and capitalization rate methodologies. We'll examine how these approaches complement each other, when each is most appropriate, and how current market conditions influence their application.
01 The Structural Foundation: Why REITs Require Specialized Valuation
REITs operate under a unique regulatory framework that fundamentally shapes their valuation. In most jurisdictions, REITs must distribute at least 90% of taxable income to shareholders, creating a capital structure that prioritizes current income over retained earnings. This distribution requirement means traditional metrics like earnings per share (EPS) growth become less relevant, while measures of distributable cash flow take center stage.
The asset-heavy nature of real estate companies creates another valuation imperative. A REIT's value derives primarily from its underlying property portfolio, making asset-based valuation approaches particularly relevant. Unlike a technology company where intangible assets and growth potential drive value, a REIT's worth is intrinsically tied to bricks, mortar, and the income streams they generate.
In early 2026, this structural reality has become even more pronounced. With the 10-year Treasury hovering around 4.3-4.5%, the spread between property yields and risk-free rates has compressed significantly compared to the 2010-2021 period. This compression has forced analysts to sharpen their valuation precision, as small differences in cap rate assumptions or NAV calculations can swing investment decisions by 15-20%.
02 Net Asset Value (NAV): The Asset-Based Foundation
Net Asset Value represents the most fundamental approach to REIT valuation, answering a deceptively simple question: What are the company's assets worth, net of all liabilities? While conceptually straightforward, NAV calculation requires sophisticated judgment about property values, particularly for assets that don't trade frequently.
Calculating NAV: The Core Methodology
The NAV calculation follows a systematic process:
- Gross Asset Value (GAV): Sum the fair market value of all properties in the portfolio, typically derived from independent appraisals, recent transactions, or capitalization of net operating income
- Less: Net Debt: Subtract total debt (including credit facilities, bonds, and mortgages) and add back cash and equivalents
- Less: Other Liabilities: Account for deferred taxes, derivative liabilities, and other balance sheet obligations
- Add: Other Assets: Include investments in joint ventures, development pipelines at fair value, and other non-property assets
- Divide by Shares Outstanding: Calculate NAV per share for comparison to market price
The critical judgment point lies in determining property values. For stabilized, income-producing assets, analysts typically capitalize net operating income (NOI) at an appropriate cap rate for each property type and location. For a Class A office building in a gateway market generating $5 million in NOI, applying a 6.5% cap rate yields a property value of approximately $76.9 million. Multiply this across a portfolio of 50-100 properties, and small cap rate variations create massive NAV swings.
Premium and Discount to NAV: Market Signals
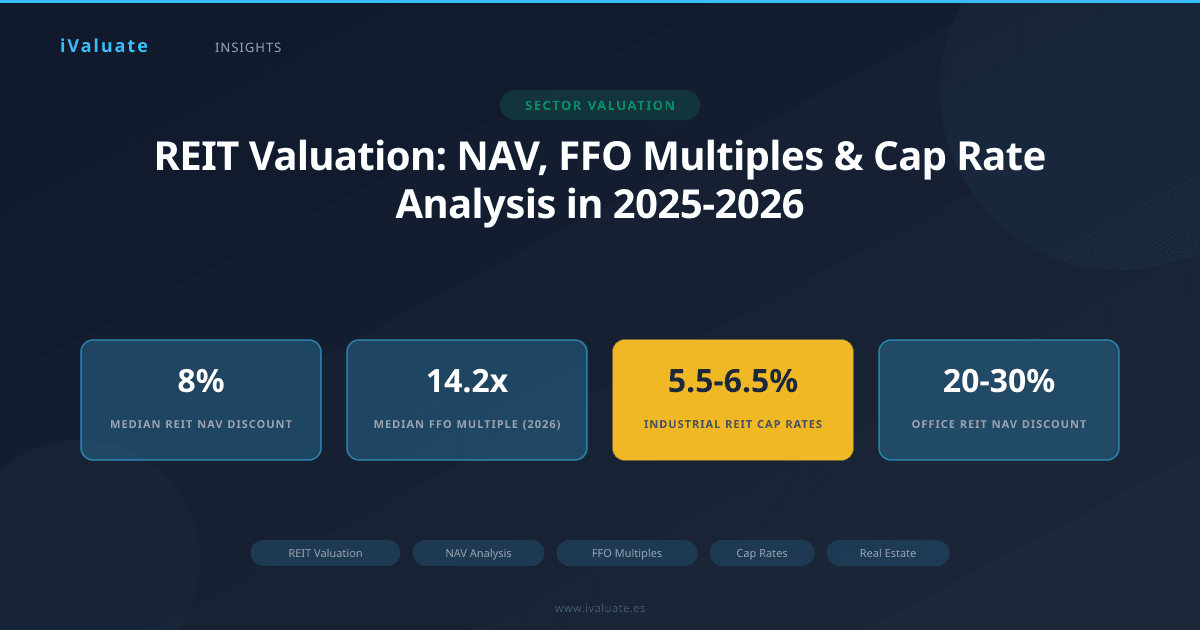
The relationship between a REIT's trading price and its NAV provides crucial market intelligence. As of Q1 2026, the median U.S. equity REIT trades at approximately 92% of consensus NAV, representing an 8% discount. This discount varies dramatically by sector:
- Industrial REITs: Trading at 105-110% of NAV, reflecting strong fundamentals and limited new supply
- Data Center REITs: Commanding 115-125% premiums due to AI-driven demand and scarcity value
- Office REITs: Trading at 70-80% of NAV, with some suburban office portfolios at 60% discounts reflecting structural headwinds
- Retail REITs: Ranging from 85-95% of NAV for well-positioned shopping centers, to 75-85% for regional malls
These premiums and discounts reflect market expectations about management quality, portfolio positioning, and future value creation. A persistent premium suggests the market believes management will create value through active asset management, development, or strategic capital allocation. Conversely, sustained discounts may signal concerns about asset quality, overleveraging, or structural challenges in the underlying property sector.
A REIT trading at a 20% discount to NAV isn't automatically a bargain—it may reflect legitimate concerns about declining property values, lease rollover risk, or capital structure sustainability. Conversely, a 15% premium demands scrutiny of whether growth expectations are realistic.
NAV Sensitivity and Stress Testing
Professional REIT analysis requires sensitivity analysis around NAV calculations. In the current environment, I recommend testing three scenarios:
Base Case: Current market cap rates and occupancy assumptions
Bear Case: Cap rates expand 50-75 basis points, occupancy declines 3-5%, rental rates flatten
Bull Case: Cap rates compress 25-50 basis points, occupancy improves 2-3%, rental growth accelerates
For a typical diversified REIT, this sensitivity analysis might show NAV ranging from $45 per share (bear) to $58 per share (bull) around a base case of $52. If the stock trades at $47, this suggests the market is pricing in a scenario between base and bear—valuable information for positioning.
03 Funds From Operations (FFO): The Cash Flow Cornerstone
While NAV provides an asset-based perspective, FFO and its variants offer an operating performance lens. FFO, developed by the National Association of Real Estate Investment Trusts (NAREIT), adjusts net income to better reflect the cash-generating ability of real estate operations.
FFO Calculation and Refinements
The standard FFO calculation starts with GAAP net income and makes several critical adjustments:
- Add back: Depreciation and amortization on real estate assets
- Add back: Losses on property sales (or subtract gains)
- Subtract: Gains on sale of depreciated property
- Adjust for: Unconsolidated partnerships and joint ventures
The logic is straightforward: real estate generally appreciates or maintains value over time, making depreciation a non-cash charge that distorts economic reality. A well-maintained apartment building doesn't lose 3% of its value annually through depreciation—it may actually appreciate. FFO removes this accounting artifact to reveal true operating performance.
However, FFO has limitations, leading to further refinements:
Adjusted Funds From Operations (AFFO): Also called "CAD" (Cash Available for Distribution), AFFO makes additional adjustments for recurring capital expenditures, straight-line rent adjustments, and non-cash compensation. This provides the most accurate picture of distributable cash flow. The typical AFFO calculation subtracts 5-8% of revenues for recurring capex, though this varies significantly by property type.
Core FFO: Some analysts prefer "Core FFO" which excludes one-time items, transaction costs, and other non-recurring charges to isolate ongoing operational performance.
FFO Multiple Valuation
FFO multiples provide a relative valuation framework analogous to P/E ratios for traditional equities. As of early 2026, median FFO multiples across the REIT universe stand at approximately 14.2x forward FFO, down from the 18-20x range prevalent in 2021 but above the 12-13x levels seen during the 2022-2023 rate shock.
Sector-specific multiples reveal the market's growth and risk assessments:
- Industrial/Logistics: 18-22x FFO, reflecting 4-6% annual FFO growth expectations and defensive characteristics
- Residential/Multifamily: 16-19x FFO, supported by housing shortages and demographic tailwinds
- Healthcare: 14-17x FFO, with senior housing at the lower end and medical office at the higher end
- Retail: 11-15x FFO, with significant dispersion based on tenant quality and format
- Office: 8-12x FFO, reflecting structural uncertainty about space demand
FFO multiple analysis should always be paired with growth expectations. A REIT trading at 20x FFO with 8% annual growth (PEG ratio of 2.5) may be expensive, while one at 15x with 6% growth (PEG of 2.5) offers similar relative value. The key is ensuring the multiple reflects sustainable growth rather than temporary tailwinds.
Real-World Example: Industrial REIT Valuation
Consider a hypothetical industrial REIT with the following characteristics as of Q1 2026:
- Current FFO per share: $3.20
- Expected 2026 FFO: $3.38 (5.6% growth)
- Expected 2027 FFO: $3.55 (5.0% growth)
- Current dividend: $2.50 (78% payout ratio)
- Portfolio occupancy: 97.2%
- Weighted average lease term: 5.8 years
Comparable industrial REITs trade at 19-21x forward FFO. Applying a 20x multiple to 2026 FFO of $3.38 yields a fair value of $67.60. If the stock trades at $62, it represents an 8% discount to this FFO-based valuation, potentially offering an attractive entry point for investors confident in the growth trajectory.
04 Capitalization Rates: The Bridge Between Assets and Operations
Capitalization rates (cap rates) serve as the critical link between property-level economics and portfolio valuation. The cap rate represents the unlevered yield an investor requires to own a property, calculated as Net Operating Income divided by property value.
Understanding Cap Rate Dynamics
Cap rates reflect the intersection of multiple factors:
- Risk-free rate: The foundational return available on government securities
- Real estate risk premium: Additional return demanded for property-specific risks
- Growth expectations: Lower cap rates for properties with strong NOI growth potential
- Liquidity premium: Higher cap rates for less liquid property types or markets
- Property-specific factors: Location, tenant quality, lease duration, physical condition
The relationship between cap rates and interest rates has tightened considerably in 2025-2026. Historically, cap rates maintained a 200-300 basis point spread over the 10-year Treasury. With Treasuries at 4.3-4.5%, this would suggest cap rates in the 6.3-7.5% range. However, actual transaction cap rates show significant variation:
Industrial: 5.5-6.5% for institutional-quality logistics facilities in primary markets
Multifamily: 5.0-6.0% for Class A properties in high-growth markets
Office: 7.0-9.5% depending on quality, location, and lease profile
Retail: 6.5-8.0% for grocery-anchored centers, 8.0-10.0% for enclosed malls
Data Centers: 5.0-6.0% for stabilized, investment-grade facilities
Implied Cap Rates and Market Validation
Analysts can reverse-engineer implied cap rates from REIT trading prices, providing a market-based validation of property values. If a REIT's market capitalization plus net debt equals $2 billion, and the portfolio generates $130 million in NOI, the implied cap rate is 6.5%. Comparing this to transaction cap rates for comparable properties reveals whether the market is pricing the portfolio at a premium or discount to private market values.
This analysis becomes particularly powerful when tracking implied cap rates over time. A widening spread between a REIT's implied cap rate and transaction cap rates may signal an attractive buying opportunity, assuming no fundamental deterioration in the portfolio.
In Q4 2025, office REITs showed implied cap rates averaging 8.7%, while actual transaction cap rates for comparable properties ranged from 7.5-8.2%. This 50-120 basis point gap suggested the public markets were pricing in further value deterioration beyond what private market transactions reflected—a bearish signal that proved prescient as several office REITs subsequently wrote down asset values.
Cap Rate Sensitivity in Valuation Models
Small changes in cap rate assumptions create outsized valuation impacts. For a property generating $10 million in NOI:
- At a 6.0% cap rate: Value = $166.7 million
- At a 6.5% cap rate: Value = $153.8 million (7.7% decline)
- At a 7.0% cap rate: Value = $142.9 million (14.3% decline from 6.0%)
This sensitivity demands rigorous cap rate selection based on comparable transactions, property characteristics, and market conditions. I recommend building cap rate assumptions from the bottom up: start with the risk-free rate, add appropriate risk premiums, and validate against recent transactions for similar properties.
05 Integrating the Three Methodologies: A Holistic Framework
Professional REIT valuation requires synthesizing NAV, FFO multiples, and cap rate analysis into a coherent investment thesis. Each methodology provides unique insights:
NAV analysis reveals whether the market is pricing the portfolio above or below replacement cost and private market values. It's particularly valuable for asset-heavy REITs with stabilized portfolios and limited growth initiatives.
FFO multiples capture the market's assessment of operating performance, growth potential, and management quality. They work best for REITs with strong internal growth drivers, development pipelines, or active asset management strategies.
Cap rate analysis provides the bridge between property-level economics and portfolio valuation, offering a reality check on both NAV and FFO-based valuations.
Case Study: Divergent Signals and Investment Implications
Consider a healthcare REIT specializing in medical office buildings with the following valuation metrics as of March 2026:
- Trading price: $42 per share
- Consensus NAV: $48 per share (12.5% discount)
- Forward FFO: $2.90 per share
- FFO multiple: 14.5x (sector median: 15.5x)
- Implied cap rate: 6.8%
- Transaction cap rates: 6.3-6.5% for comparable properties
This REIT trades at a discount across all three methodologies, suggesting potential value. However, deeper analysis reveals the discount reflects legitimate concerns: 35% of leases expire in the next 24 months, several major hospital system tenants face financial stress, and the portfolio skews toward secondary markets experiencing physician practice consolidation.
The valuation discount isn't a buying signal—it's a warning. This illustrates why mechanical application of valuation metrics fails. Professional analysis requires understanding the business drivers behind the numbers.
06 Current Market Environment: 2025-2026 Considerations
The 2025-2026 period presents unique valuation challenges shaped by several macro factors:
Interest Rate Environment: With rates stabilizing in the 4.0-4.5% range after the 2022-2023 hiking cycle, cap rates have largely adjusted, but the spread compression versus Treasuries continues to pressure valuations. REITs must demonstrate value creation beyond simply owning assets.
Sector Divergence: The performance gap between property sectors has widened dramatically. Industrial and data center REITs trade at all-time high multiples, while office REITs languish at decade lows. This divergence demands sector-specific expertise rather than broad REIT market views.
Private-Public Valuation Gap: The gap between public REIT valuations and private market transactions has narrowed from the extreme levels of 2022-2023 but remains wider than historical norms for several sectors, creating opportunities for privatizations and take-private transactions.
Balance Sheet Quality: With refinancing risk elevated for debt maturing in 2026-2027, balance sheet analysis has become paramount. REITs with well-laddered debt maturities and unencumbered asset pools command valuation premiums of 10-15% versus peers facing near-term refinancing at higher rates.
07 Advanced Considerations for Professional Analysis
Beyond the core methodologies, sophisticated REIT valuation incorporates several advanced considerations:
Development Pipeline Valuation
REITs with active development programs require careful assessment of projects under construction and in the pipeline. I value development projects using a probability-weighted approach: stabilized NOI capitalized at an appropriate rate, discounted for lease-up risk and time to stabilization, then probability-weighted based on project stage. A project 80% leased and 90% complete might receive 85-90% credit toward NAV, while a project in early construction with no pre-leasing might receive only 40-50% credit.
Joint Venture and Unconsolidated Investment Analysis
Many REITs hold significant investments in joint ventures and unconsolidated entities. These require separate valuation, typically using the same NAV and FFO methodologies applied to the consolidated portfolio, adjusted for the REIT's ownership percentage and any structural features of the JV agreement.
Tax Considerations and REIT Conversion Opportunities
For property companies considering REIT conversion or REITs potentially losing their status, tax implications create significant valuation impacts. The built-in gains tax liability from converting appreciated assets to REIT status can reduce NAV by 15-25%, while the ongoing tax efficiency of REIT status (no corporate-level tax) supports higher multiples.
08 Practical Implementation and Tools
Implementing these valuation methodologies requires robust analytical infrastructure. Professional analysts build detailed property-by-property models, maintain databases of comparable transactions and cap rates, and track FFO and NAV estimates across coverage universes.
The complexity of REIT valuation—juggling dozens of properties, multiple methodologies, and constantly evolving market data—makes specialized tools increasingly valuable. Platforms like iValuate streamline this process, allowing professionals to efficiently build NAV models, apply appropriate cap rates, calculate FFO metrics, and generate comprehensive valuation reports. The time saved on mechanical calculations allows analysts to focus on the judgmental aspects that truly drive investment returns: assessing management quality, understanding market dynamics, and identifying mispriced opportunities.
09 Conclusion: Mastering REIT Valuation in a Complex Market
REIT valuation demands a multi-faceted approach that integrates asset-based NAV analysis, operating performance through FFO multiples, and property-level economics via cap rates. No single methodology tells the complete story; professional analysis requires synthesizing all three perspectives while understanding the business fundamentals that drive value creation.
As we navigate the 2025-2026 market environment, characterized by elevated interest rates, sector divergence, and heightened scrutiny of balance sheet quality, valuation precision has never been more critical. The difference between a REIT trading at 0.90x NAV because of temporary market dislocation versus structural impairment can mean the difference between a 40% return and a permanent capital loss.
The most successful REIT investors and advisors combine technical valuation mastery with deep sector knowledge and business judgment. They understand that a 6.5% cap rate for a Class A industrial property in Northern Virginia reflects different fundamentals than a 6.5% cap rate for a suburban office building in Phoenix. They recognize that a 15x FFO multiple for a REIT with 3% growth is expensive, while the same multiple for a REIT with 7% growth may be attractive.
For professionals seeking to enhance their REIT valuation capabilities, investing in robust analytical frameworks and tools pays dividends through better investment decisions and more credible client advice. Whether you're evaluating acquisition opportunities, advising on portfolio strategy, or making public market investment decisions, the frameworks outlined in this article provide the foundation for rigorous, defensible valuation analysis. Modern platforms like iValuate further enhance this capability by automating routine calculations and maintaining current market data, allowing professionals to focus their expertise where it matters most: interpreting the numbers and making sound investment judgments.