Table of Contents8 sections
Real estate investment trusts (REITs) and property companies represent a unique valuation challenge that sits at the intersection of traditional equity analysis and real estate appraisal. Unlike operating companies valued primarily on earnings multiples, REITs require a multi-faceted approach that accounts for underlying property values, cash generation capacity, and market-specific dynamics. As we navigate the 2025-2026 environment—characterized by stabilizing interest rates following the aggressive tightening cycle and evolving property sector fundamentals—understanding the interplay between Net Asset Value (NAV), Funds From Operations (FFO) multiples, and capitalization rates has never been more critical.
This article provides a comprehensive framework for valuing REITs and property companies, examining the technical foundations of each methodology, their practical applications, and the market conditions that determine when each approach provides the most reliable valuation signal.
01 The Unique Economics of REIT Structures
Before diving into specific valuation methodologies, it's essential to understand what makes REITs fundamentally different from traditional corporations. REITs are required by statute to distribute at least 90% of taxable income to shareholders, creating a pass-through structure that eliminates corporate-level taxation. This requirement fundamentally alters the capital allocation framework and makes traditional earnings-based metrics like P/E ratios less meaningful.
The REIT structure creates several valuation implications:
- Limited retained earnings: REITs cannot accumulate significant cash reserves, making them perpetual capital markets participants for growth
- Depreciation distortion: Real estate often appreciates while GAAP accounting requires depreciation, creating a disconnect between reported earnings and economic reality
- Asset-intensive nature: The value proposition centers on property ownership and management, not operational leverage
- Interest rate sensitivity: As yield-oriented investments, REIT valuations respond directly to changes in the risk-free rate and credit spreads
These characteristics necessitate specialized valuation approaches that capture both the asset backing and cash generation capacity of the REIT structure.
02 Net Asset Value (NAV): The Foundation of REIT Valuation
Net Asset Value represents the estimated market value of a REIT's property portfolio and other assets, less all liabilities. NAV analysis essentially replicates what a buyer would pay to acquire the entire company and own the underlying real estate directly. This approach is particularly relevant for REITs because, unlike most corporations, their primary value derives from tangible, marketable assets.
Calculating NAV: A Detailed Framework
The NAV calculation follows a systematic process:
Step 1: Value the Property Portfolio
The core of NAV analysis involves estimating the fair market value of each property or property segment. The most common approach applies capitalization rates to stabilized Net Operating Income (NOI):
Property Value = Stabilized NOI / Capitalization Rate
For a retail REIT with a property generating $5.0 million in stabilized NOI and a market cap rate of 6.5%, the implied property value would be $76.9 million. This calculation must be performed across the entire portfolio, often segmented by property type, geography, and quality tier.
Step 2: Adjust for Development and Value-Add Assets
Properties under development or renovation require different treatment. Development projects are typically valued at cost plus a reasonable profit margin (often 15-20% for completed, stabilized projects), while value-add properties may be valued at a premium to current NOI to reflect anticipated improvements.
Step 3: Add Non-Property Assets
This includes cash, marketable securities, investments in unconsolidated joint ventures (typically at GAAP book value or independently appraised values), and other tangible assets.
Step 4: Subtract All Liabilities
Deduct all debt (at face value, though mark-to-market adjustments may be appropriate for fixed-rate debt in changing rate environments), preferred equity, and other liabilities including deferred taxes if applicable.
Step 5: Calculate Per-Share NAV
Divide the resulting equity value by fully diluted shares outstanding, including operating partnership units and other convertible securities common in REIT structures.
NAV Premium/Discount Analysis
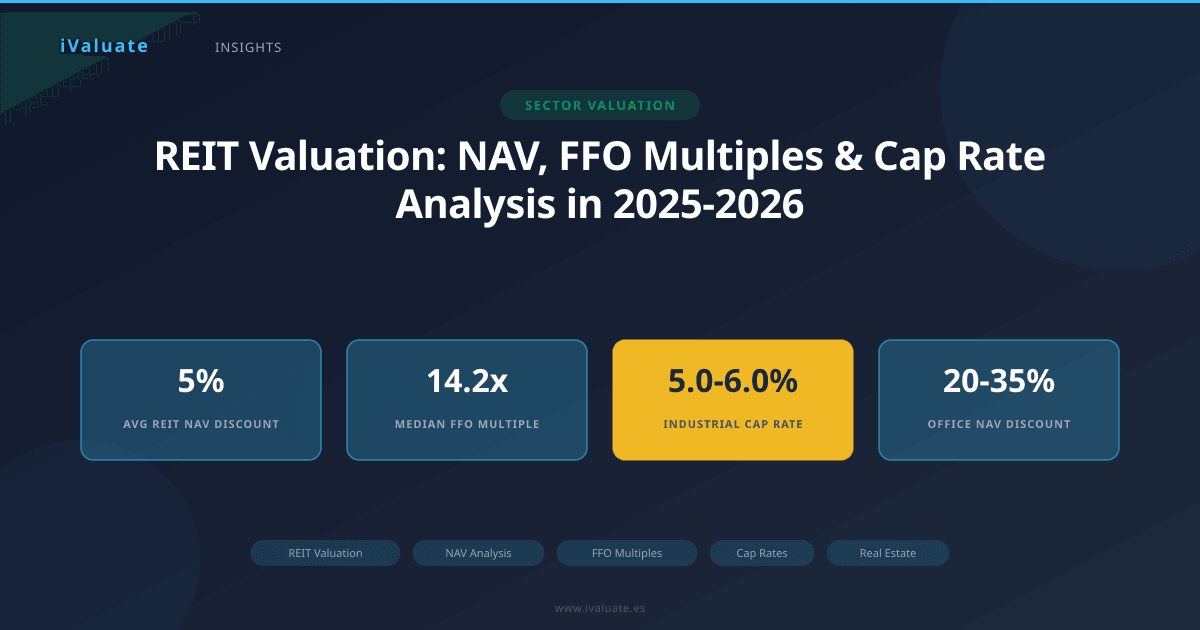
The relationship between a REIT's trading price and its NAV provides critical valuation insight. In early 2025, the average U.S. equity REIT trades at approximately 95% of estimated NAV, representing a modest 5% discount. However, this aggregate figure masks significant dispersion:
- Industrial and data center REITs: Trading at 5-15% premiums to NAV, reflecting strong secular demand and limited supply
- Office REITs: Trading at 20-35% discounts to NAV, reflecting structural headwinds from remote work adoption
- Retail REITs: Trading at 0-10% discounts, with significant variation based on property quality and tenant mix
- Residential REITs: Trading near NAV on average, with multifamily at slight premiums and manufactured housing at slight discounts
These premiums and discounts reflect market expectations about management quality, growth prospects, balance sheet strength, and sector-specific fundamentals that NAV alone cannot capture.
Case Example: Industrial REIT NAV Analysis
Consider a hypothetical industrial REIT with 50 million square feet generating $400 million in NOI. Using a blended cap rate of 5.25% (reflecting the compressed cap rates in the industrial sector driven by e-commerce demand), the property portfolio values at $7.62 billion. Adding $150 million in cash and $200 million in joint venture investments, then subtracting $3.0 billion in debt and $500 million in preferred equity, yields an equity NAV of $4.47 billion. With 200 million shares outstanding, the per-share NAV equals $22.35. If the stock trades at $24.50, it reflects a 9.6% premium, suggesting the market values management's ability to create value above the static asset base.
03 Funds From Operations (FFO): The REIT Earnings Metric
While NAV provides an asset-based valuation floor, Funds From Operations and its variants measure the ongoing cash generation capacity of the REIT. FFO was developed by the National Association of Real Estate Investment Trusts (NAREIT) specifically to address the limitations of GAAP net income for real estate companies.
Understanding FFO and Its Variants
FFO Calculation:
FFO starts with GAAP net income and makes several adjustments:
- Add back real estate depreciation and amortization
- Add back impairment charges on real estate assets
- Subtract gains (add losses) on sales of real estate
- Adjust for unconsolidated partnerships and joint ventures
The logic is straightforward: real estate depreciation is a non-cash charge that typically doesn't reflect economic reality (properties often appreciate), while gains on sales are non-recurring and shouldn't be included in a run-rate earnings measure.
Adjusted Funds From Operations (AFFO):
Many analysts prefer AFFO, which makes additional adjustments to approximate true distributable cash flow:
- Subtract normalized recurring capital expenditures and tenant improvement costs
- Subtract straight-line rent adjustments (GAAP recognizes rent evenly; AFFO uses cash rent)
- Add back non-cash compensation expenses
- Adjust for other non-recurring or non-cash items
AFFO provides a cleaner measure of sustainable dividend capacity and is often considered the most relevant metric for dividend coverage analysis.
FFO Multiple Valuation
FFO multiples work similarly to P/E ratios for traditional companies. The Price/FFO multiple reflects what investors are willing to pay for each dollar of funds from operations. As of Q1 2025, median FFO multiples across the REIT universe stand at approximately 14.2x forward FFO, though sector variation is substantial:
- Cell tower REITs: 20-25x FFO (reflecting long-term contracted revenue and growth visibility)
- Data center REITs: 18-22x FFO (driven by AI and cloud computing demand)
- Industrial REITs: 16-20x FFO (supported by e-commerce and supply chain reconfiguration)
- Healthcare REITs: 12-15x FFO (stable but growth-constrained)
- Office REITs: 8-11x FFO (depressed by structural uncertainty)
FFO multiples are influenced by several factors:
- Growth expectations: Higher anticipated FFO growth commands premium multiples
- Dividend yield: Inverse relationship—higher yields typically correlate with lower multiples
- Balance sheet quality: Lower leverage and better debt metrics support higher multiples
- Property quality and location: Trophy assets in prime markets justify premium valuations
- Management track record: Demonstrated value creation ability expands multiples
Case Example: Retail REIT FFO Analysis
A regional mall REIT reports 2024 FFO of $2.10 per share and guides to 2025 FFO of $2.18 per share (3.8% growth). The company maintains a conservative 55% debt-to-total-assets ratio and pays a $1.50 annual dividend (68.8% payout ratio on 2025 FFO). Comparable retail REITs trade at 11-13x forward FFO. Applying a 12x multiple to the $2.18 guidance yields a $26.16 fair value estimate. The current $24.00 trading price suggests an 8.3% discount, potentially offering value if the company can execute its repositioning strategy and maintain occupancy.
04 Capitalization Rates: The Bridge Between Assets and Cash Flow
Capitalization rates (cap rates) represent the expected annual return on a real estate investment based on the income the property generates. The cap rate is calculated as:
Cap Rate = Net Operating Income / Property Value
Cap rates serve dual purposes in REIT valuation: they're both an input to NAV calculations (as shown earlier) and a standalone valuation metric that reflects market pricing of real estate risk and return.
Cap Rate Dynamics in 2025-2026
The cap rate environment has stabilized following significant expansion in 2022-2023 when the Federal Reserve raised rates from near-zero to 5.25-5.50%. As of early 2025, with the Fed having implemented modest cuts to a 4.50-4.75% range, cap rates across major property sectors reflect the following dynamics:
- Industrial: 5.0-6.0% (compressed by strong fundamentals despite higher rates)
- Multifamily: 5.25-6.25% (moderate expansion from 2021 lows but stabilizing)
- Retail (grocery-anchored): 6.0-7.0% (stable, supported by necessity-based tenants)
- Office (CBD Class A): 6.5-8.5% (wide range reflecting uncertainty and flight to quality)
- Self-storage: 6.0-7.0% (normalized from pandemic-era compression)
The relationship between cap rates and the 10-year Treasury yield—often called the "cap rate spread"—provides insight into relative value. Historically, this spread averaged 200-300 basis points. In early 2025, with the 10-year Treasury around 4.3%, the average spread has compressed to approximately 150-200 basis points for core property types, suggesting that real estate pricing has not fully adjusted to the higher-rate environment, or that investors anticipate further rate declines.
Using Cap Rates for Valuation Cross-Checks
Cap rates provide a valuable cross-check against FFO-based valuations. Consider a REIT trading at 15x FFO with a 6.67% implied cap rate (1/15 = 6.67%). If comparable private market transactions are occurring at 5.5% cap rates, this suggests the REIT may be undervalued—private market buyers are willing to accept lower returns for similar assets.
The implied cap rate can be calculated from public market pricing:
Implied Cap Rate = (NOI per share / Price per share) × 100
Comparing implied cap rates to transaction cap rates in the private market reveals potential mispricings and helps explain NAV premiums or discounts.
05 Integrating the Three Approaches: A Holistic Framework
Sophisticated REIT valuation requires synthesizing NAV, FFO multiples, and cap rate analysis into a coherent framework. Each methodology provides different insights:
- NAV: Establishes the asset-based floor value and reveals market expectations through premium/discount analysis
- FFO multiples: Captures growth expectations, management quality, and relative valuation versus peers
- Cap rates: Connects public market pricing to private market fundamentals and reveals sector-specific risk premiums
Reconciliation Framework
When these approaches yield different valuations, the divergence itself provides analytical value:
High FFO multiple, low NAV premium: Suggests the market values management's ability to grow FFO through development, acquisitions, or operational improvements rather than just owning static assets. This is common for REITs with strong development pipelines.
Low FFO multiple, high NAV premium: May indicate the market expects FFO growth to slow or that the REIT trades primarily as an asset play. This pattern often emerges in mature, low-growth REITs with trophy assets.
Compressed cap rates, expanding FFO multiples: Suggests improving property fundamentals that haven't fully flowed through to current earnings but are anticipated by the market.
Real-World Application: Multifamily REIT Valuation
A multifamily REIT owns 50,000 apartment units across Sun Belt markets with an average NOI per unit of $8,500. Using a 5.75% cap rate (reflecting strong Sun Belt fundamentals and population migration trends), the property portfolio values at $7.39 billion ($425 million NOI / 5.75%). After adjusting for $2.5 billion in debt and adding $100 million in other assets, NAV reaches $4.99 billion, or $24.95 per share on 200 million shares.
The REIT reports 2025 FFO guidance of $1.85 per share with 4% expected annual growth through 2027. Comparable multifamily REITs trade at 16-18x forward FFO. Applying a 17x multiple yields a $31.45 valuation, representing a 26% premium to NAV.
This premium is justified by several factors: the REIT's development pipeline (adding 3,000 units annually), superior same-store NOI growth (averaging 5.5% versus 3.8% for peers), and best-in-class balance sheet (40% debt-to-assets versus 45% peer average). The valuation synthesis suggests fair value in the $28-30 range, balancing asset backing with growth prospects.
06 Market Conditions and Methodology Selection
The relative importance of each valuation approach shifts with market conditions:
Rising Rate Environments: NAV and cap rate analysis become more critical as the discount rate applied to future cash flows increases. FFO multiples often compress across the board, making relative FFO analysis less discriminating.
Falling Rate Environments: FFO multiples tend to expand and become more differentiated based on growth prospects. NAV premiums often widen as investors look beyond static asset values.
Distressed Markets: NAV provides the most reliable valuation floor, as asset liquidation values become more relevant. Cap rates may be unreliable due to transaction market illiquidity.
Growth Markets: FFO multiples and growth-adjusted metrics (PEG ratios using FFO) become primary valuation drivers, with NAV serving mainly as a downside reference point.
07 Common Pitfalls and Technical Considerations
Several technical issues can undermine REIT valuation accuracy:
Lease Accounting Complexity: Straight-line rent accounting creates timing differences between GAAP revenue and cash collection. Always analyze cash same-store NOI alongside reported figures.
Joint Venture Structures: Many REITs use JVs extensively, requiring careful analysis of proportionate share economics and potential consolidation impacts.
Development Risk: Development projects carry execution risk and should be valued conservatively in NAV, typically at cost until stabilization rather than at pro forma stabilized values.
Debt Maturity Walls: Analyze debt maturity schedules carefully. Significant near-term maturities in a high-rate environment can force dilutive refinancing or asset sales.
Geographic Concentration: REITs concentrated in specific markets carry idiosyncratic risk that may not be fully captured in sector-average cap rates or multiples.
Key Takeaway: REIT valuation requires simultaneous consideration of asset values (NAV), cash generation (FFO), and market pricing of real estate returns (cap rates). No single metric tells the complete story—the interplay between these approaches reveals both absolute value and relative positioning.
08 Looking Ahead: REIT Valuation in an Evolving Landscape
As we progress through 2025 and into 2026, several trends will shape REIT valuation dynamics:
Interest Rate Normalization: With the Fed likely maintaining rates in the 4-5% range absent significant economic deterioration, REITs must demonstrate value creation beyond multiple expansion. This environment favors REITs with genuine operational improvements and development capabilities.
Sector Divergence: The gap between winning sectors (industrial, data centers, select multifamily) and challenged sectors (office, certain retail formats) will likely persist. Valuation methodologies must account for structural rather than cyclical headwinds.
Private Market Repricing: As private real estate values continue adjusting to higher cap rates, the gap between public REIT pricing and private market values may narrow, potentially compressing NAV premiums for favored sectors.
ESG Integration: Environmental, social, and governance factors—particularly energy efficiency and climate resilience—are increasingly embedded in cap rates and FFO multiples as institutional investors demand sustainable assets.
For professionals conducting REIT valuations, the technical complexity and data requirements have never been greater. Accurate NAV analysis requires current market cap rates across multiple property types and geographies. FFO analysis demands detailed modeling of lease expirations, renewal economics, and capital expenditure requirements. Cap rate analysis requires tracking private market transactions and understanding nuanced property-level risk factors.
Modern valuation platforms like iValuate help professionals navigate this complexity by integrating property-level data, market comparables, and financial modeling capabilities into unified workflows. As REIT structures become more sophisticated and property markets more fragmented, the ability to efficiently synthesize multiple valuation approaches while maintaining analytical rigor separates exceptional analysis from superficial coverage.
The fundamentals remain unchanged: REITs are valued on their ability to own, operate, and develop real estate more efficiently than private market participants. NAV establishes what those assets are worth today, FFO multiples reflect expectations for tomorrow, and cap rates bridge public market pricing with private market reality. Mastering the interplay between these three pillars enables professionals to identify mispriced securities, advise on strategic transactions, and allocate capital with confidence in an asset class that represents over $1.5 trillion in U.S. market capitalization alone.