Table of Contents9 sections
Real estate investment trusts (REITs) and property companies occupy a unique position in corporate valuation, straddling the boundary between operating businesses and passive asset holdings. Unlike traditional corporations valued primarily on earnings multiples, property companies require specialized methodologies that account for underlying real estate assets, income generation characteristics, and the structural peculiarities of REIT taxation. As institutional capital allocation to real estate has grown to represent approximately $4.5 trillion in global listed property securities as of early 2026, mastering these valuation frameworks has become essential for investment professionals.
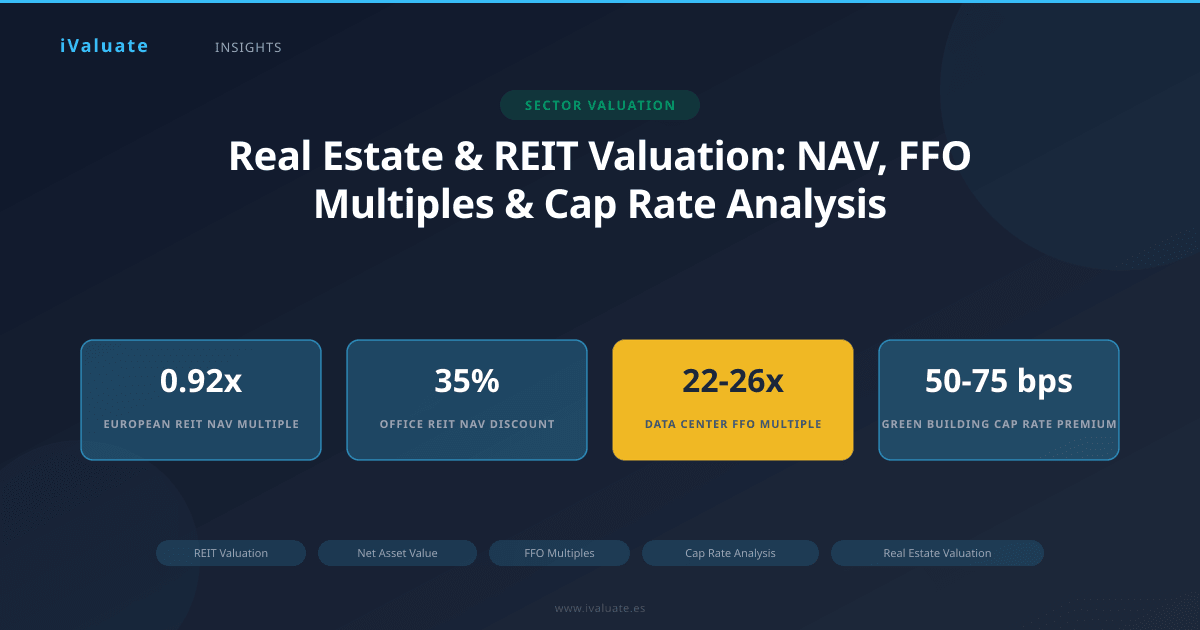
The convergence of rising interest rates, hybrid work patterns reshaping office demand, and logistics sector transformation has created significant valuation dispersion across property subsectors. U.S. office REITs traded at an average 35% discount to Net Asset Value in Q1 2026, while industrial REITs commanded premiums approaching 15-20% to NAV. Understanding the interplay between Net Asset Value, Funds From Operations multiples, and capitalization rates enables analysts to identify mispricings and assess whether market valuations reflect underlying property fundamentals.
01 Net Asset Value: The Foundation of Property Company Valuation
Net Asset Value represents the most fundamental approach to valuing property companies, essentially treating the entity as a portfolio of real estate assets. NAV methodology values each property in the portfolio at current market value, subtracts all liabilities, and divides by shares outstanding to arrive at NAV per share. This approach recognizes that a property company's intrinsic value should, at minimum, reflect the liquidation value of its underlying assets.
Calculating NAV: The Technical Framework
The NAV calculation follows a systematic process that requires both accounting expertise and real estate market knowledge. The starting point is the company's most recent balance sheet, but significant adjustments are necessary to move from book values to market values:
- Property revaluation: Historical cost accounting often understates (or occasionally overstates) current property values. Independent appraisals, recent comparable transactions, and discounted cash flow analysis inform market value estimates for each asset.
- Deferred tax adjustments: Many jurisdictions create deferred tax liabilities when properties are carried at market value above their tax basis. The treatment of these liabilities—whether to include them at full value, discount them, or exclude them entirely—significantly impacts NAV and varies by analytical convention.
- Derivative and debt adjustments: Interest rate swaps, currency hedges, and other derivatives must be marked to market. Fixed-rate debt trading below par (in rising rate environments) represents economic value that increases NAV.
- Joint venture and associate adjustments: Equity-accounted investments must be adjusted to reflect the market value of underlying properties rather than the carrying value on the balance sheet.
Consider a practical example: A European retail REIT with €2.5 billion in property assets at book value might show the following NAV calculation:
Book value of properties: €2,500 million
Revaluation to market value: +€180 million
Joint venture NAV adjustment: +€45 million
Debt mark-to-market: +€22 million
Deferred tax liability (excluded): €0
Less: Net debt: -€1,100 million
Less: Minority interests: -€35 million
NAV: €1,612 million
Shares outstanding: 125 million
NAV per share: €12.90
If this REIT trades at €10.50 per share, it trades at an 18.6% discount to NAV, potentially signaling undervaluation—though the discount itself requires interpretation.
EPRA NAV Metrics: Standardizing European Practice
The European Public Real Estate Association (EPRA) has developed standardized NAV metrics that have become industry benchmarks, particularly for cross-border comparison. As of 2025, EPRA recommends three primary NAV measures:
- EPRA NRV (Net Reinvestment Value): Assumes entities never sell assets, representing the value required to rebuild the portfolio. Includes real estate transfer taxes and excludes deferred taxes on property revaluations.
- EPRA NTA (Net Tangible Assets): Assumes entities buy and sell assets in the ordinary course of business. This has become the most widely referenced metric, with median European REIT trading at 0.92x NTA in Q4 2025.
- EPRA NDV (Net Disposal Value): Represents shareholders' value under an immediate portfolio liquidation scenario, including all disposal costs and taxes.
The adoption of these standardized metrics has improved transparency and comparability, though North American practice still predominantly uses simpler NAV calculations without the EPRA refinements.
Premium/Discount to NAV: Interpretation Framework
The relationship between market price and NAV reveals market sentiment about management quality, portfolio positioning, and growth prospects. Persistent premiums or discounts contain important information:
Premiums to NAV (trading above asset value) typically indicate: exceptional management with value creation capabilities; portfolios positioned in high-growth markets or property types; development pipelines with embedded profit; or scarcity value in tightly-held quality assets. Leading U.S. industrial REITs like Prologis have historically traded at 10-25% premiums to NAV, reflecting their development expertise and portfolio quality in supply-constrained logistics markets.
Discounts to NAV (trading below asset value) may signal: concerns about asset quality or appraisal accuracy; poor capital allocation or governance; structural headwinds in the property subsector; or illiquidity and holding company discounts. Office REITs in major markets have traded at substantial NAV discounts since 2023, with some CBD office-focused REITs at 40-50% discounts reflecting fundamental concerns about long-term office demand rather than temporary mispricing.
Importantly, NAV discounts can persist for extended periods when they reflect genuine structural issues rather than temporary mispricings. The analytical challenge lies in distinguishing between value traps and genuine opportunities.
02 Funds From Operations: The REIT Earnings Metric
While NAV provides an asset-based valuation floor, Funds From Operations (FFO) and its variants capture the ongoing earnings power of property companies. FFO was developed specifically for REITs because traditional net income is distorted by non-cash depreciation charges that don't reflect the economic reality of well-maintained real estate, which often appreciates rather than depreciates.
FFO Calculation and Adjustments
The National Association of Real Estate Investment Trusts (NAREIT) defines FFO as net income (computed in accordance with GAAP), excluding gains or losses from sales of property, plus depreciation and amortization of real estate assets, and after adjustments for unconsolidated partnerships and joint ventures. The formula:
FFO = Net Income + Depreciation & Amortization of Real Estate - Gains on Property Sales + Losses on Property Sales
However, FFO itself has evolved into several variants that analysts must understand:
- Core FFO or Adjusted FFO: Further adjusts FFO to remove non-recurring items such as debt extinguishment costs, acquisition expenses, or one-time legal settlements. This metric better represents sustainable, recurring earnings.
- AFFO (Adjusted Funds From Operations): Also called CAD (Cash Available for Distribution) or FAD (Funds Available for Distribution), AFFO subtracts normalized recurring capital expenditures required to maintain properties. This represents the true cash generation available for distribution to shareholders.
The distinction matters significantly. A REIT might report FFO of $2.50 per share but AFFO of $2.20 per share after accounting for $0.30 per share in recurring maintenance capex. If the dividend is $2.40 per share, the REIT appears well-covered on an FFO basis (96% payout ratio) but is actually distributing more than sustainable cash generation (109% AFFO payout ratio).
FFO Multiple Valuation
REITs and property companies are commonly valued using Price/FFO or EV/FFO multiples, analogous to P/E ratios for traditional corporations. These multiples vary significantly by property type, growth profile, and market conditions:
As of Q1 2026, median FFO multiples across major property sectors showed substantial dispersion:
- Data centers: 22-26x FFO (reflecting strong secular growth from AI and cloud computing)
- Industrial/logistics: 18-21x FFO (supported by e-commerce growth despite normalization from pandemic peaks)
- Residential (multifamily): 16-19x FFO (benefiting from housing supply constraints)
- Retail (shopping centers): 12-14x FFO (recovery from pandemic lows but structural challenges remain)
- Office: 8-12x FFO (significant uncertainty about long-term space demand)
- Lodging/hotels: 11-14x FFO (cyclical exposure and operating leverage considerations)
These multiples reflect market expectations about growth, risk, and capital requirements. Higher multiples generally indicate expectations of above-average FFO growth, lower risk profiles, or both. The 14-point spread between data center and office FFO multiples in early 2026 represents one of the widest sector valuation dispersions in REIT market history.
FFO Growth and the PEG Framework
Sophisticated analysts evaluate FFO multiples relative to expected growth rates, similar to PEG ratios in equity analysis. A REIT trading at 20x FFO with 8% expected annual FFO growth (PEG of 2.5) may be more expensive than a REIT at 16x FFO with 10% growth expectations (PEG of 1.6). However, this framework requires careful application because REIT growth often requires significant capital investment, unlike asset-light business models where earnings growth may flow through to free cash flow.
The relationship between FFO multiples and dividend yields also provides valuation context. In a normalized environment, REIT dividend yields typically exceed 10-year government bond yields by 100-200 basis points to compensate for equity risk. When this spread compresses below 100 basis points, it often signals stretched valuations. Conversely, spreads exceeding 300 basis points have historically presented attractive entry points, though such wide spreads may reflect genuine concerns about dividend sustainability.
03 Capitalization Rates: Linking Property Values to Income
Capitalization rates (cap rates) form the critical bridge between property-level analysis and corporate valuation. The cap rate represents the ratio of a property's Net Operating Income (NOI) to its market value, essentially the unlevered yield an investor receives from a property:
Cap Rate = Net Operating Income / Property Value
Cap rates serve multiple functions in property company valuation: they provide market-based validation of NAV calculations, enable comparison across properties and portfolios, and reveal market sentiment about risk and growth prospects for different property types and locations.
Cap Rate Determinants and Market Dynamics
Cap rates reflect the interplay of numerous factors:
Risk-free rates and credit spreads: Cap rates generally move with government bond yields, though the relationship is imperfect and varies by property type. The 425 basis point increase in 10-year Treasury yields from 2021 to 2023 drove cap rate expansion across most property sectors, though the magnitude varied significantly.
Property-specific risk: Higher-risk properties (secondary locations, older buildings, single-tenant exposure) command higher cap rates. The spread between prime CBD office cap rates and suburban secondary office cap rates widened from approximately 100 basis points in 2019 to 250-300 basis points by 2025, reflecting differentiated risk perceptions.
Growth expectations: Properties with strong NOI growth potential trade at lower cap rates (higher values relative to current income). This explains why industrial properties in supply-constrained logistics hubs traded at cap rates 150-200 basis points below the broader industrial market in 2025-2026.
Liquidity and market depth: More liquid property markets with active transaction volume typically exhibit lower cap rates than thin markets where finding buyers is challenging.
Implied Cap Rates and NAV Validation
Analysts can calculate implied cap rates from REIT valuations to assess whether market pricing aligns with private market property values. The implied cap rate calculation works backward from market capitalization:
Implied Cap Rate = (NOI × Shares Outstanding + Net Debt) / Market Cap + Net Debt
Or simplified: NOI / Enterprise Value
Comparing implied cap rates to observable transaction cap rates in private markets reveals whether REITs trade at premiums or discounts to private market values. In early 2026, U.S. apartment REITs showed implied cap rates of approximately 5.2-5.4%, while private market multifamily transactions were occurring at 5.0-5.3% cap rates, suggesting relatively fair valuation. Conversely, office REITs showed implied cap rates of 7.5-8.5% while private transactions (where they occurred) suggested cap rates of 6.5-7.5%, indicating either REIT undervaluation or, more likely, that private market pricing hadn't fully adjusted to new fundamentals.
Terminal Cap Rates in DCF Analysis
When valuing property companies using discounted cash flow methodology, the terminal value calculation typically employs a terminal cap rate applied to projected stabilized NOI. This terminal cap rate becomes one of the most sensitive assumptions in the valuation:
A property company projected to generate $150 million in stabilized NOI in year 10, valued at a 6.0% terminal cap rate, yields a terminal property value of $2.5 billion. Increasing the terminal cap rate to 6.5% (reflecting higher perceived risk or lower growth expectations) reduces terminal value to $2.31 billion—a 7.6% reduction from a 50 basis point cap rate change. This sensitivity underscores why cap rate assumptions require rigorous support and scenario analysis.
Conservative practice suggests using terminal cap rates 25-50 basis points above current market cap rates to reflect the uncertainty inherent in long-term projections and the possibility that properties may be less competitive as they age.
04 Integrated Valuation: Synthesizing NAV, FFO, and Cap Rates
Sophisticated property company valuation requires synthesizing these three methodologies rather than relying on any single approach. Each framework provides different insights and serves as a check on the others.
Case Study: Diversified Office REIT Valuation
Consider a hypothetical analysis of a diversified office REIT in Q1 2026:
Company Profile: 15 million square feet across 45 properties in major U.S. markets, 92% occupied, weighted average lease term of 6.2 years, 35% debt-to-total-assets ratio.
NAV Analysis: Independent appraisals suggest portfolio value of $3.8 billion. After subtracting $1.4 billion in net debt and $50 million in minority interests, NAV reaches $2.35 billion, or $23.50 per share on 100 million shares outstanding. The company trades at $16.75, representing a 29% discount to NAV.
FFO Analysis: The REIT projects FFO of $1.95 per share for 2026, implying a forward FFO multiple of 8.6x. Peer office REITs trade at 8-12x FFO depending on portfolio quality and growth prospects. The company's FFO multiple appears reasonable relative to peers, though the wide peer range reflects significant market uncertainty about office fundamentals.
Cap Rate Analysis: The portfolio generates $285 million in NOI. With enterprise value of $3.075 billion (market cap of $1.675 billion plus net debt of $1.4 billion), the implied cap rate is 9.3%. Recent office transactions in similar markets have occurred at 7.0-8.0% cap rates, suggesting the market is pricing in either significant NOI decline expectations or applying a substantial illiquidity discount.
Synthesis: The 29% NAV discount and 9.3% implied cap rate (well above transaction market) suggest the market doubts either the sustainability of current NOI or the accuracy of appraisal values. The FFO multiple appears in line with peers, providing less directional insight. An analyst might conclude:
- If office fundamentals stabilize and occupancy/rents hold, the REIT offers significant upside as the NAV discount compresses
- If office demand continues deteriorating, current appraisals overstate values, and the 29% discount may be justified or insufficient
- The risk/reward depends critically on one's view of structural office demand—a qualitative judgment that quantitative metrics alone cannot resolve
05 Sector-Specific Considerations and Recent Market Dynamics
Different property sectors require nuanced application of these valuation frameworks based on their unique characteristics.
Industrial and Logistics REITs
Industrial REITs have been among the strongest performers, with many trading at premiums to NAV throughout 2024-2026. These premiums reflect: exceptional development capabilities that create value above replacement cost; portfolios concentrated in supply-constrained markets where land for new development is limited; and long-term secular tailwinds from e-commerce and supply chain reconfiguration. However, by late 2025, some analysts questioned whether 15-20% NAV premiums and 20x+ FFO multiples fully reflected the normalization of logistics demand after pandemic-driven acceleration.
Data Center REITs
Data center REITs represent perhaps the most complex valuation challenge, trading at the highest FFO multiples in the REIT universe (22-26x in early 2026). Traditional cap rate analysis proves challenging because these assets combine real estate with significant technology infrastructure. The explosive growth in AI computing demand has driven extraordinary rent growth expectations, but the capital intensity required to build AI-capable facilities and the risk of technological obsolescence create significant uncertainty around sustainable returns on invested capital.
Residential REITs
Multifamily REITs benefit from relatively predictable cash flows and favorable supply-demand dynamics in many markets, supporting mid-teen FFO multiples and modest premiums or small discounts to NAV. The key valuation driver is rent growth expectations, which vary dramatically by market based on local supply pipelines, employment growth, and affordability constraints. Single-family rental REITs, a newer category, trade at premiums to multifamily REITs reflecting higher growth expectations but face questions about scalability and operating efficiency.
06 Common Valuation Pitfalls and Best Practices
Even experienced analysts can fall into traps when valuing property companies:
Appraisal lag and stale NAVs: Property appraisals occur periodically (often annually or semi-annually), creating lag between market conditions and reported NAVs. In rapidly changing markets, NAV calculations may be outdated before publication. Cross-checking implied cap rates against current transaction evidence helps identify stale appraisals.
Ignoring capital requirements: High FFO doesn't necessarily translate to value creation if the business requires constant capital investment. REITs with significant development pipelines or aging portfolios requiring renovation may show strong FFO growth but generate limited cash available for distribution after funding capital needs.
Overlooking lease expiry profiles: Two REITs with identical current NOI may have very different values if one faces 40% lease expiries in the next two years while the other has a weighted average lease term of eight years. Lease expiry analysis is essential for assessing NOI sustainability and growth prospects.
Misunderstanding REIT taxation: REITs must distribute at least 90% of taxable income to maintain tax-advantaged status, limiting retained earnings for growth. This structural feature means REIT growth often requires accessing capital markets, making valuation relative to NAV and cost of capital critical for assessing whether growth creates or destroys value.
Sector-specific metrics: Different property types have specialized metrics beyond FFO—same-store NOI growth, revenue per available room (RevPAR) for hotels, occupancy costs as a percentage of sales for retail. Ignoring these sector-specific indicators can lead to incomplete analysis.
07 The Role of Technology in Modern REIT Valuation
The complexity of property company valuation—requiring detailed property-level analysis, market research, and integration of multiple methodologies—has historically made it time-intensive and prone to error. Modern valuation platforms have transformed this landscape by automating data aggregation, standardizing calculations, and enabling rapid scenario analysis.
Sophisticated analysts now employ technology to: aggregate property-level data from disclosure documents and create detailed portfolio models; track transaction cap rates across property types and geographies in real-time; model sensitivity of valuations to key assumptions like terminal cap rates, rent growth, and discount rates; and compare implied metrics across peer groups to identify relative value opportunities.
The integration of artificial intelligence and machine learning is beginning to enhance property valuation by identifying comparable transactions more effectively, predicting rent growth based on local economic indicators, and flagging potential appraisal discrepancies. However, these technologies augment rather than replace human judgment—the qualitative assessment of management quality, market positioning, and structural trends remains essential.
08 Forward-Looking Considerations for 2026 and Beyond
As we progress through 2026, several themes are reshaping property company valuation:
Interest rate normalization: After the dramatic rate increases of 2022-2023, rates have stabilized at levels significantly above the 2010-2021 period. This "higher for longer" environment has permanently reset cap rates upward and compressed FFO multiples. REITs must demonstrate value creation above their cost of capital in this new paradigm, rather than relying on multiple expansion from falling rates.
Sustainability and ESG integration: Properties with superior energy efficiency, lower carbon intensity, and strong ESG credentials increasingly command valuation premiums. The gap between "green" and "brown" building cap rates has widened to 50-75 basis points in many markets, and this spread appears likely to persist as regulatory requirements tighten and tenant preferences evolve.
Technology disruption: Beyond data centers, technology is reshaping property fundamentals across sectors—from retail transformation driven by omnichannel strategies to office evolution incorporating flexible space and amenitization. Valuation must account for properties' adaptability to changing use patterns.
Private-public arbitrage: The significant divergence between public REIT valuations and private market pricing in several sectors creates opportunities for corporate actions—take-privates when REITs trade at deep NAV discounts, or asset sales when private market buyers will pay premiums to public market implied values.
09 Conclusion: Mastering the Multidimensional Framework
Real estate and REIT valuation demands fluency across multiple methodologies—NAV analysis to understand asset values, FFO multiples to assess earnings power and growth, and cap rate analysis to connect property-level economics to corporate valuation. No single metric tells the complete story; rather, the interplay between these approaches reveals whether market pricing reflects underlying fundamentals or presents opportunity.
The substantial valuation dispersion across property sectors in 2025-2026—with some REITs trading at significant premiums while others languish at deep discounts to NAV—underscores that property company valuation is as much about qualitative judgment regarding future trends as quantitative analysis of current metrics. The most successful analysts combine rigorous technical analysis with informed perspectives on structural demand drivers, competitive dynamics, and management quality.
For professionals conducting regular property company analysis, efficiency and accuracy in applying these frameworks is paramount. Modern platforms like iValuate enable analysts to perform comprehensive NAV calculations, FFO multiple analysis, and cap rate assessments with greater speed and consistency than traditional spreadsheet-based approaches, allowing more time for the strategic thinking that truly differentiates analysis. As property markets continue evolving through 2026 and beyond, mastery of these valuation fundamentals—enhanced by technological tools—will remain essential for identifying value in an increasingly complex and differentiated sector.