Table of Contents10 sections
In the high-stakes world of mergers and acquisitions, few documents carry more weight than the Quality of Earnings (QoE) report. While management presentations showcase impressive revenue growth and robust EBITDA margins, the QoE analysis serves as the ultimate reality check—a forensic examination that separates sustainable economic performance from accounting artifacts, one-time windfalls, and aggressive revenue recognition. In today's market environment, where private equity dry powder exceeded $2.8 trillion globally in early 2025 and competition for quality assets remains fierce, the QoE report has evolved from a due diligence formality into the definitive valuation gatekeeper.
The fundamental premise is deceptively simple: reported financial statements, even when prepared in accordance with GAAP or IFRS, rarely reflect the true economic earnings power of a business. A comprehensive QoE analysis dissects historical financial performance to identify and quantify adjustments necessary to arrive at sustainable, normalized EBITDA—the metric upon which most middle-market valuations are ultimately based. The implications are profound: a 10% adjustment to EBITDA on a business trading at 8.0x can shift enterprise value by nearly $1 million for every $1 million of reported EBITDA, fundamentally altering deal economics and return expectations.
01 The Anatomy of Quality of Earnings Analysis
A rigorous QoE examination extends far beyond simple EBITDA reconciliation. Leading advisory firms structure these analyses around several core pillars, each designed to answer critical questions about earnings sustainability and business quality.
Revenue Quality and Recognition
Revenue analysis forms the foundation of any QoE report. Professionals examine not just the quantum of revenue, but its quality, sustainability, and compliance with accounting standards. This includes detailed testing of:
- Revenue recognition policies: Particularly critical in software, construction, and service businesses where timing differences can materially impact reported results
- Customer concentration: Revenue derived from the top 10 customers, contract renewal rates, and pricing power dynamics
- Channel analysis: Mix between direct sales, distributors, and digital channels, with particular attention to margin profiles
- Organic versus inorganic growth: Separating acquisition-driven revenue from true same-store growth
- Pull-forward revenue: Identifying instances where sales were accelerated into the current period through promotional activity or other means
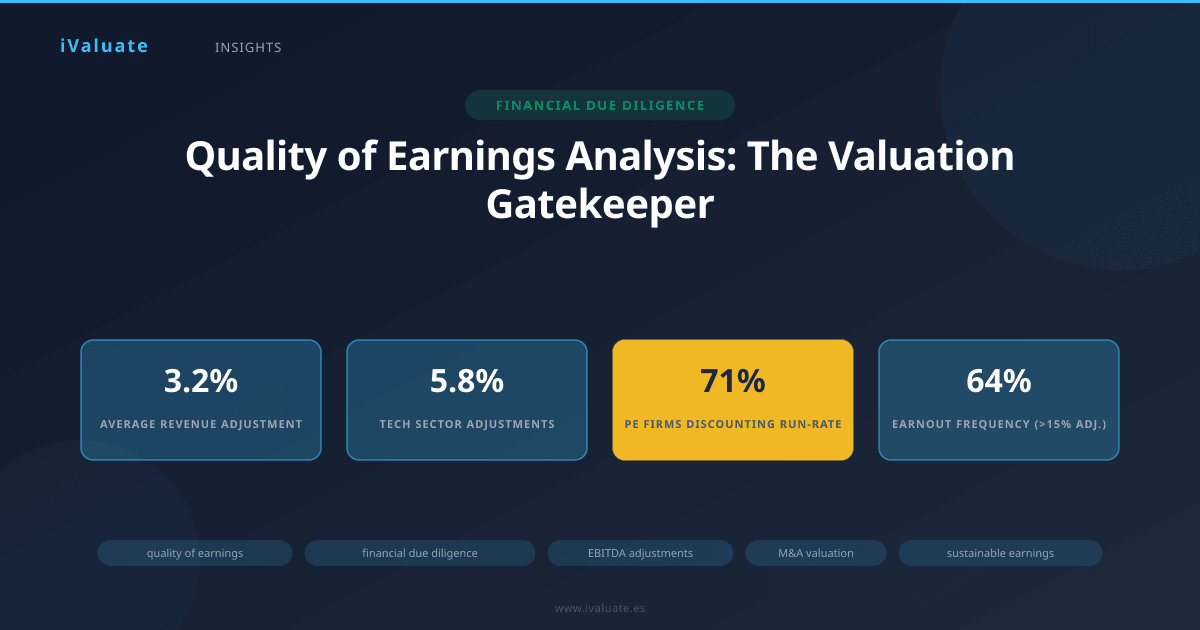
In a 2024 analysis of 147 middle-market QoE reports, revenue adjustments averaged 3.2% of reported revenue, with software and technology companies experiencing adjustments of 5.8% on average—often related to multi-year contract accounting and deferred revenue treatment.
Cost Structure and Margin Sustainability
Understanding the true cost structure requires forensic analysis of expense categories, particularly those subject to management discretion or timing variability. Key areas of focus include:
- Compensation normalization: Adjusting for below-market owner compensation, excess family member salaries, or deferred bonus accruals
- Vendor relationships: Identifying related-party transactions, favorable supplier terms that may not transfer, or concentration risks
- Discretionary spending: Normalizing R&D, marketing, and maintenance expenditures to sustainable run-rates
- Occupancy costs: Adjusting for below-market leases (particularly owner-occupied real estate) or excess facility costs
The margin sustainability analysis often reveals the most significant adjustments. In one representative case from Q2 2025, a specialty manufacturing business reported EBITDA margins of 18.2%. The QoE analysis identified $2.1 million in below-market rent (property owned by the selling shareholders), $890,000 in deferred maintenance, and $1.3 million in one-time customer acquisition costs that had been capitalized. Adjusted EBITDA margins normalized to 14.7%—a difference that reduced the enterprise value by approximately $28 million at the agreed 8.0x multiple.
02 The Normalization Cascade: From Reported to Sustainable EBITDA
The journey from reported EBITDA to sustainable, normalized EBITDA follows a systematic adjustment cascade. Understanding this framework is essential for both buyers and sellers navigating valuation discussions.
Standard EBITDA Adjustments
The first layer involves standard add-backs that most sophisticated parties accept with minimal debate:
- Interest expense: Removed to arrive at enterprise value independent of capital structure
- Taxes: Eliminated as they reflect shareholder-level considerations rather than operating performance
- Depreciation and amortization: Non-cash charges added back, though with careful consideration of required maintenance capex
- Stock-based compensation: Often added back in private company contexts, though increasingly scrutinized as a real economic cost
One-Off and Non-Recurring Items
This category generates the most negotiation and requires the most rigorous documentation:
- Transaction-related costs: Legal, accounting, and advisory fees associated with the current sale process
- Litigation settlements: One-time legal expenses or settlements, provided they truly are non-recurring
- Restructuring charges: Severance, facility closure costs, or other transformation expenses
- Gain/loss on asset sales: Proceeds or losses from divested business units or real estate
- Insurance recoveries: One-time proceeds that inflate current period results
Critical insight: The "one-off" designation requires professional skepticism. If a business has experienced "non-recurring" litigation expenses in three of the past four years, these costs are by definition recurring and should inform normalized earnings expectations.
Run-Rate and Pro Forma Adjustments
These adjustments project current operational changes into historical periods to reflect the business as it will be operated going forward:
- Recent acquisitions: Full-year impact of businesses acquired mid-period
- Pricing actions: Annualized impact of price increases implemented during the period
- Cost reduction initiatives: Savings from restructuring actions not yet fully realized
- New customer contracts: Revenue from significant wins signed but not yet fully ramped
Run-rate adjustments require particular scrutiny. In the current market, buyers have become increasingly resistant to aggressive pro forma adjustments, particularly revenue synergies or cost savings not yet evidenced in actual results. A 2025 survey of 83 private equity professionals found that 71% now apply a discount factor of 25-50% to seller-proposed run-rate adjustments, reflecting skepticism born from post-close disappointments.
03 Quality of Earnings Red Flags: What Sophisticated Buyers Watch For
Experienced acquirers and their advisors have developed pattern recognition for earnings quality issues that signal elevated risk or valuation concerns.
Revenue Recognition Aggressiveness
Several indicators suggest potential revenue quality issues:
- Days sales outstanding (DSO) trending upward: Growing receivables relative to revenue may indicate channel stuffing or collection issues
- Deferred revenue declining as percentage of revenue: In subscription businesses, this can signal slowing bookings growth
- Fourth quarter revenue concentration: When Q4 represents >35% of annual revenue in non-seasonal businesses, it raises questions about sustainability
- Frequent restatements or policy changes: Multiple changes to revenue recognition policies suggest either complexity or aggressive management
Working Capital Dynamics
Working capital analysis often reveals earnings quality issues before they appear in the income statement:
- Inventory turns declining: May indicate obsolescence, demand softness, or aggressive production to absorb overhead
- Accounts payable stretched beyond terms: Can artificially inflate cash flow while signaling liquidity stress
- Prepaid expenses unusually high: May represent capitalized costs that should flow through the P&L
In a notable 2024 transaction, QoE analysis of a distribution business revealed that reported EBITDA of $12.4 million included approximately $1.8 million of profit from inventory purchased at distressed pricing from a bankrupt competitor—a true one-time opportunity. Additionally, the company had extended payables from 35 to 58 days over the prior 18 months, effectively borrowing $3.2 million from suppliers. The normalized EBITDA calculation reduced the figure to $10.1 million and required a working capital adjustment at close, fundamentally resetting deal economics.
Customer and Vendor Concentration
While not strictly an earnings quality issue, concentration analysis directly impacts valuation:
- Top customer >15% of revenue: Typically triggers valuation discount of 0.5-1.0x EBITDA multiple
- Top 3 customers >40% of revenue: Raises fundamental questions about business sustainability and transferability
- Single-source suppliers: Creates operational risk that sophisticated buyers reflect in pricing
04 The Valuation Impact: Quantifying the QoE Effect
The financial impact of QoE adjustments extends beyond simple EBITDA normalization. Sophisticated buyers incorporate QoE findings into multiple aspects of valuation and deal structure.
Multiple Compression
Earnings quality issues often trigger valuation multiple compression beyond the mathematical impact of EBITDA adjustments. Buyers apply lower multiples when QoE analysis reveals:
- High earnings volatility: Coefficient of variation in adjusted EBITDA >25% typically results in 0.5-1.5x multiple reduction
- Customer concentration: As noted above, material concentration can compress multiples by 0.5-1.0x
- Accounting aggressiveness: Multiple restatements or aggressive policies may reduce multiples by 0.5-1.0x
- Working capital intensity: Businesses requiring >15% of revenue in working capital often trade at 1.0-2.0x lower multiples than asset-light peers
Deal Structure Implications
QoE findings directly influence transaction structure and risk allocation:
- Earnout provisions: Significant run-rate adjustments often shift into earnout structures, with 30-40% of consideration contingent on achieving projected performance
- Working capital pegs: QoE-identified working capital trends inform normalized working capital targets, with dollar-for-dollar adjustments at close
- Indemnification baskets and caps: Earnings quality concerns may result in lower baskets (triggering seller liability sooner) and higher caps (increasing maximum exposure)
- Escrow provisions: Material QoE adjustments often increase escrow from typical 10% to 15-20% of consideration
Market data from 2024-2025 indicates that transactions where QoE analysis identified EBITDA adjustments exceeding 15% resulted in earnout structures in 64% of cases, compared to just 28% of transactions with adjustments under 10%.
05 Industry-Specific QoE Considerations
Different sectors present unique earnings quality challenges that require specialized analytical approaches.
Software and Technology
SaaS and software businesses demand particular scrutiny around:
- Revenue recognition under ASC 606: Multi-element arrangements, professional services revenue, and license versus subscription treatment
- Customer acquisition costs (CAC): Capitalization policies and payback period analysis
- Churn rates: Logo churn versus revenue churn, cohort analysis, and net revenue retention
- Development costs: Capitalization of software development costs under ASC 985-20
Technology QoE reports in 2025 have increasingly focused on the sustainability of growth rates, with particular attention to the ratio of sales and marketing expense to new ARR—a key indicator of customer acquisition efficiency and margin sustainability.
Healthcare Services
Healthcare businesses require specialized analysis of:
- Reimbursement rates: Payer mix, rate negotiations, and regulatory changes
- Compliance and regulatory: Potential liability from billing practices or quality metrics
- Provider relationships: Physician employment agreements, non-competes, and retention risk
- Accounts receivable: Aging, payer denials, and collection rates by payer category
Manufacturing and Distribution
Industrial businesses present distinct challenges:
- Inventory valuation: LIFO/FIFO impacts, obsolescence reserves, and lower-of-cost-or-market adjustments
- Maintenance capex: Distinguishing growth capex from true maintenance requirements
- Commodity exposure: Raw material cost volatility and hedging effectiveness
- Environmental liabilities: Potential remediation obligations not reflected on balance sheet
06 The Seller's Perspective: Preparing for QoE Scrutiny
Sophisticated sellers increasingly commission sell-side QoE reports 6-12 months before going to market. This proactive approach offers several advantages:
- Issue identification and remediation: Time to address accounting inconsistencies, strengthen internal controls, or implement policy changes
- Adjustment negotiation: Establishing the normalization framework before buyers conduct their own analysis
- Process acceleration: Reducing buy-side due diligence timeline by 2-4 weeks
- Valuation optimization: Ensuring that sustainable EBITDA is accurately reflected in marketing materials and valuation expectations
A sell-side QoE report commissioned in advance can increase transaction value by 3-8% through more accurate positioning, reduced buyer uncertainty, and accelerated process timelines that maintain deal momentum.
07 Current Market Trends in QoE Analysis
The QoE landscape continues to evolve in response to market conditions and emerging business models.
Technology-Enabled Analysis
Advanced analytics and automation have transformed QoE execution. Leading firms now employ:
- Data analytics platforms: Automated testing of 100% of transactions rather than sampling approaches
- AI-powered anomaly detection: Machine learning algorithms identifying unusual patterns in revenue recognition, expense timing, or working capital
- Continuous accounting: Real-time monitoring of key metrics rather than point-in-time analysis
ESG Integration
Environmental, social, and governance considerations increasingly appear in QoE scope:
- Carbon accounting: Understanding emissions profiles and potential carbon pricing impacts
- Social compliance: Labor practices, diversity metrics, and potential litigation exposure
- Governance quality: Board composition, related-party transactions, and control environment
While not traditionally part of QoE scope, 43% of private equity firms surveyed in early 2025 now request ESG-related diligence as part of the QoE workstream, reflecting the growing importance of these factors in valuation and risk assessment.
Inflation and Economic Volatility
The macroeconomic environment of 2024-2025 has intensified focus on several areas:
- Pricing power: Ability to pass through cost inflation without volume degradation
- Input cost volatility: Exposure to commodity prices, energy costs, and labor inflation
- Contract terms: Fixed-price versus cost-plus arrangements, escalation clauses, and margin protection
- Foreign exchange: Currency exposure and hedging programs in cross-border businesses
08 Case Study: QoE Analysis Reshapes Deal Economics
Consider a representative transaction from late 2024 involving a specialty chemical manufacturer. The seller's marketing materials presented compelling growth: revenue had increased from $67 million to $94 million over three years, with EBITDA growing from $8.2 million to $14.1 million—an impressive 20% EBITDA margin.
The buy-side QoE analysis, conducted over an intensive six-week period, revealed a more nuanced picture:
- Revenue quality: Approximately $4.2 million of Y3 revenue represented a one-time contract to supply a competitor experiencing production issues—a contract that had already expired
- Gross margin: Raw material costs had declined 18% during the period due to favorable commodity pricing, a trend that had already begun reversing in recent months
- Operating expenses: The company had deferred $1.1 million in facility maintenance and delayed hiring two critical engineering positions, saving approximately $340,000 annually
- Working capital: Inventory had increased from 68 to 94 days on hand, representing approximately $3.8 million of incremental investment
The normalized EBITDA calculation adjusted reported $14.1 million to $10.8 million—a 23% reduction. At the proposed 7.5x EBITDA multiple, this represented a $24.8 million reduction in enterprise value. The transaction ultimately closed at a 6.8x multiple on normalized EBITDA with a 25% earnout tied to achieving revenue and margin targets over 24 months—a structure that allocated risk appropriately while preserving upside for the seller if performance exceeded normalized expectations.
09 Best Practices for QoE Excellence
Whether commissioning or reviewing a QoE report, several practices distinguish rigorous analysis from superficial review:
- Sufficient time allocation: Comprehensive QoE analysis requires 4-8 weeks depending on business complexity; compressed timelines compromise quality
- Access to personnel: Direct interaction with accounting staff, operations leaders, and sales management provides context that documents alone cannot
- Industry expertise: Engaging advisors with sector-specific experience who understand industry-specific accounting nuances and operational metrics
- Data room organization: Well-organized financial information, including detailed general ledgers, customer contracts, and vendor agreements, accelerates analysis
- Management transparency: Proactive disclosure of known issues, accounting changes, or unusual transactions builds credibility and trust
10 Looking Forward: The Evolving Role of QoE in Valuation
As we progress through 2025 and beyond, quality of earnings analysis will only grow in importance. Several trends are reshaping the landscape:
First, the increasing complexity of business models—particularly in technology, healthcare, and services—demands more sophisticated analytical approaches. Revenue recognition for multi-element arrangements, subscription economics, and usage-based pricing models require specialized expertise that goes beyond traditional accounting review.
Second, the integration of operational due diligence with financial QoE is creating more holistic assessments. Leading firms now combine financial analysis with commercial diligence, IT infrastructure review, and human capital assessment to provide comprehensive earnings quality perspectives.
Third, the democratization of M&A through technology platforms is creating demand for more efficient QoE processes. While the rigor cannot be compromised, technology-enabled analysis allows for faster turnaround and more comprehensive testing at lower cost points.
For CFOs preparing their businesses for eventual sale, the message is clear: earnings quality matters as much as earnings quantity. Implementing robust accounting policies, maintaining clean books, and documenting the business rationale for unusual transactions pays dividends when QoE scrutiny arrives. For buyers and their advisors, the QoE report remains the essential tool for separating sustainable economic performance from accounting artistry—the ultimate valuation gatekeeper that protects against overpayment and post-close disappointment.
In an environment where deal certainty and valuation accuracy have never been more critical, professionals increasingly rely on sophisticated analytical tools to support their work. Platforms like iValuate enable finance professionals to perform comprehensive valuation analyses efficiently, incorporating the insights from QoE reports into robust valuation models that reflect true economic earnings power. As the M&A market continues to evolve, the combination of rigorous QoE analysis and advanced valuation technology will remain essential for successful transactions and optimal outcomes.