Table of Contents10 sections
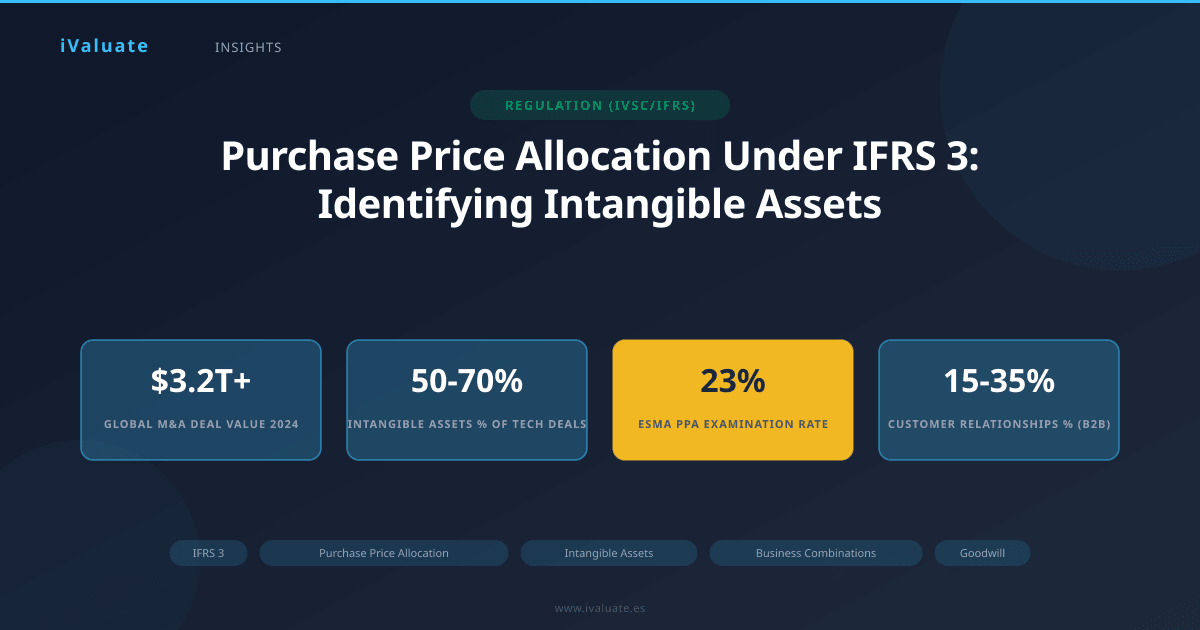
In the current M&A landscape of 2025-2026, where global deal values exceeded $3.2 trillion in 2024 and continue their upward trajectory, the technical rigor of Purchase Price Allocation (PPA) has never been more critical. Under IFRS 3 Business Combinations, acquirers must allocate the purchase price paid in a business combination to the identifiable assets acquired and liabilities assumed, measured at their acquisition-date fair values. This process, seemingly straightforward in principle, presents significant technical challenges—particularly in identifying and valuing intangible assets that often represent 50-70% of total transaction value in technology, pharmaceutical, and consumer sectors.
01 The IFRS 3 Framework: Core Requirements and Recent Developments
IFRS 3, originally issued in 2008 and subject to ongoing interpretations by the IFRS Interpretations Committee, establishes the accounting treatment for business combinations using the acquisition method. The standard requires acquirers to recognize separately from goodwill the identifiable assets acquired, the liabilities assumed, and any non-controlling interest in the acquiree. Critically, these must be measured at their acquisition-date fair values.
The 2025 environment has brought renewed scrutiny to PPA practices. Regulators including the European Securities and Markets Authority (ESMA) have emphasized in recent enforcement decisions that intangible asset identification cannot be perfunctory. In their 2024 annual report on enforcement activities, ESMA highlighted that approximately 23% of their corporate reporting examinations involved questions about business combination accounting, with intangible asset identification being the most common deficiency.
The Recognition Principle: Separability and Contractual-Legal Criteria
IFRS 3 establishes two criteria for recognizing an intangible asset separately from goodwill. The asset must be either:
- Separable: Capable of being separated or divided from the entity and sold, transferred, licensed, rented, or exchanged, either individually or together with a related contract, identifiable asset, or liability
- Arising from contractual or legal rights: Regardless of whether those rights are transferable or separable from the entity or from other rights and obligations
This dual criterion creates a broader recognition threshold than many practitioners initially appreciate. For instance, customer relationships—even when not governed by formal contracts—typically meet the separability criterion because they can be sold or licensed. This was demonstrated in the 2024 acquisition of a European SaaS company where customer relationships representing €340 million (42% of the €810 million purchase price) were recognized despite the absence of formal customer contracts, based on historical renewal patterns and the demonstrated ability to sell customer portfolios in the market.
02 Identifying Intangible Assets: A Systematic Approach
The identification phase requires a forensic examination of the target's value drivers. Based on current practice and recent transactions, intangible assets typically fall into five categories:
Marketing-Related Intangible Assets
These include trademarks, trade names, internet domain names, and non-competition agreements. In the consumer goods sector, brand value often represents 30-45% of total intangible asset value. The 2024 acquisition of a premium beverage company illustrates this: the acquirer recognized brand intangibles of $1.8 billion against a total purchase price of $4.2 billion, supported by a relief-from-royalty valuation that applied a 4.5% royalty rate to projected branded revenues of $620 million annually.
Customer-Related Intangible Assets
Customer relationships represent one of the most significant—and most technically challenging—categories in PPA. These assets encompass customer lists, customer contracts, order backlogs, and the broader customer relationship value. The valuation typically employs the Multi-Period Excess Earnings Method (MPEEM), which isolates the cash flows attributable specifically to customer relationships after deducting returns required for contributory assets.
In 2025 transactions, we observe customer relationship values ranging from 15-35% of purchase price in B2B services, 25-40% in software and technology, and 10-20% in traditional manufacturing. A recent pharmaceutical services acquisition demonstrated the complexity: customer relationships valued at $890 million incorporated attrition rates of 8-12% annually, operating margins of 24%, and a weighted average cost of capital (WACC) of 9.8%, with contributory asset charges reducing the attributable cash flows by approximately 40%.
Technology-Based Intangible Assets
This category includes patented technology, unpatented technology, databases, trade secrets, and software. The technology sector has seen particular focus here, with developed technology often representing 20-35% of deal value. The valuation approach varies: patented technology typically uses relief-from-royalty or cost-to-recreate methods, while software platforms often employ a replacement cost approach adjusted for economic obsolescence.
A 2024 acquisition in the artificial intelligence sector provides insight: the acquirer recognized developed AI algorithms at $420 million using a relief-from-royalty method with a 12% royalty rate applied to projected technology-enabled revenues, while in-process research and development (IPR&D) was recognized separately at $180 million based on probability-weighted cash flows from pipeline projects.
Contract-Based Intangible Assets
These include licensing agreements, royalty agreements, lease agreements (when favorable or unfavorable), franchise agreements, and supply contracts. The valuation typically compares contractual terms to current market terms, with the differential representing the intangible asset (or liability) value.
In the current elevated interest rate environment of 2025-2026, with risk-free rates at 4.2-4.8% across major economies, the present value impact on long-duration contract-based intangibles has become more pronounced, often reducing values by 15-25% compared to the low-rate environment of 2020-2021.
Artistic-Related Intangible Assets
While less common in most transactions, these include copyrights, musical compositions, and video content libraries. Media and entertainment acquisitions see these assets representing 40-60% of total intangible value. The valuation typically employs a relief-from-royalty or income approach based on projected exploitation revenues.
03 Valuation Methodologies: Technical Application
IFRS 13 Fair Value Measurement governs the valuation of assets and liabilities in a PPA context. The standard establishes a fair value hierarchy and requires the use of valuation techniques appropriate in the circumstances and for which sufficient data are available, maximizing the use of relevant observable inputs.
The Multi-Period Excess Earnings Method (MPEEM)
MPEEM remains the predominant approach for customer relationship valuation. The methodology involves:
- Projecting revenues attributable to the existing customer base, incorporating attrition rates
- Applying appropriate operating margins to derive earnings before interest and taxes (EBIT)
- Deducting tax expense to calculate after-tax operating income
- Adding back depreciation and amortization, subtracting capital expenditures and working capital requirements
- Deducting contributory asset charges (CACs) for working capital, fixed assets, assembled workforce, and other intangible assets
- Discounting resulting cash flows at an appropriate discount rate
The technical challenge lies in the contributory asset charges. These represent the return that would be required on assets that contribute to the generation of cash flows from customer relationships. In 2025 practice, we typically observe:
- Working capital: 4-6% return (approximating short-term borrowing rates)
- Fixed assets: 8-12% return (reflecting asset-specific risk)
- Assembled workforce: 15-20% return (reflecting human capital risk)
- Technology/trade names: 18-25% return (reflecting intangible asset risk)
A practical example from a 2025 business services acquisition illustrates the mechanics. The target generated $450 million in annual revenue with a customer base of 1,200 clients. The analysis projected revenue attrition of 10% annually, EBITDA margins of 28%, and applied contributory asset charges totaling $82 million annually in year one. Using a 10.5% discount rate, the customer relationship value was determined to be $385 million, representing 31% of the $1.24 billion purchase price.
Relief-From-Royalty Method
This approach, commonly applied to trade names, trademarks, and technology, estimates the value of an intangible asset by calculating the present value of the hypothetical royalty payments that would be saved because the acquirer owns the asset rather than licensing it. The critical inputs include:
- Projected revenues attributable to the intangible asset
- Market-derived royalty rate (typically sourced from RoyaltyRange, ktMINE, or comparable licensing transactions)
- Tax amortization benefit (where applicable)
- Appropriate discount rate
In the current market, we observe royalty rates ranging from 0.5-2% for trade names in commodity industries, 3-6% for established brands in consumer sectors, 4-8% for specialized technology, and 8-15% for patent portfolios in pharmaceutical and high-tech sectors. The 2025 interest rate environment has pushed discount rates to 9-14% for most intangible assets, compared to 7-11% in the 2020-2021 period.
Cost Approach and Replacement Cost
For certain intangible assets—particularly databases, assembled workforce (when recognized in certain jurisdictions), and some technology assets—the cost approach provides the most reliable indication of value. This method estimates the cost to recreate or replace the asset, adjusted for physical, functional, and economic obsolescence.
The challenge lies in quantifying obsolescence. In a 2024 technology acquisition, a customer database was initially valued at $140 million based on recreation costs (3.2 million customer records at $43.75 per record), but economic obsolescence adjustments of 35% reduced the final value to $91 million, reflecting the reality that not all database records generate equal economic value.
04 Goodwill: The Residual Component
After identifying and valuing all intangible assets meeting the recognition criteria, goodwill represents the residual—the excess of purchase price over the fair value of identifiable net assets. IFRS 3 describes goodwill as representing future economic benefits arising from assets that are not capable of being individually identified and separately recognized.
In practice, goodwill typically encompasses:
- Assembled workforce (in IFRS jurisdictions where this cannot be recognized separately)
- Expected synergies from combining operations
- Going concern value
- The excess of purchase price paid over fair value (including any overpayment)
Current market data from 2024-2025 transactions shows goodwill representing 35-55% of purchase price in most sectors, though this varies significantly. Technology acquisitions often see goodwill at 45-65% due to high synergy expectations and growth premiums, while manufacturing deals typically range from 25-40%.
The distinction between identifiable intangible assets and goodwill carries significant financial reporting implications. Identifiable intangibles are amortized over their useful lives (typically 5-20 years), while goodwill is not amortized but subject to annual impairment testing. This difference can impact reported earnings by 3-8% annually in the years following acquisition.
05 Practical Challenges and Common Pitfalls
The Assembled Workforce Dilemma
IFRS 3 explicitly prohibits recognizing assembled workforce as a separate intangible asset, requiring it to be subsumed within goodwill. However, the standard requires a contributory asset charge for workforce in MPEEM calculations. This creates a technical inconsistency that practitioners must navigate carefully. The workforce charge typically ranges from 25-40% of annual compensation costs, reflecting the return required on the investment in human capital.
Defensive Intangible Assets
Some intangible assets are acquired primarily for defensive purposes—to prevent competitors from obtaining them rather than for their direct exploitation. IFRS 3 requires these assets to be recognized at fair value if they meet the recognition criteria, even if the acquirer does not intend to actively use them. The valuation must reflect a market participant perspective, not the acquirer's specific intentions.
In-Process Research and Development
IPR&D represents a particularly complex category. Under IFRS 3, IPR&D must be recognized as an intangible asset at fair value, even if it has no alternative future use. The valuation typically employs a probability-weighted income approach, incorporating technical success probabilities, regulatory approval probabilities (in pharmaceuticals), and commercialization assumptions. In 2025, we observe IPR&D representing 10-25% of purchase price in pharmaceutical and biotech acquisitions, with discount rates of 12-18% reflecting development risk.
06 Discount Rate Determination in the 2025-2026 Environment
The discount rate selection represents one of the most judgmental aspects of PPA. The rate must reflect the risk characteristics of the specific intangible asset being valued. In the current macroeconomic environment, we observe:
- Customer relationships: Typically WACC + 0-200 basis points, currently 9.5-12.5% for most industries
- Trade names and trademarks: Typically WACC + 100-300 basis points, currently 10.5-13.5%
- Developed technology: Typically WACC + 200-400 basis points, currently 11.5-14.5%
- IPR&D: Typically WACC + 400-800 basis points, currently 13.5-18.5%
The elevated risk-free rate environment of 2025-2026 has compressed risk premiums somewhat, as the baseline return expectation has increased. This has led to more rigorous debate about appropriate asset-specific risk adjustments.
07 Documentation and Audit Considerations
Robust documentation is essential for defending PPA conclusions. Best practice includes:
- Detailed identification memoranda explaining why each intangible asset meets IFRS 3 recognition criteria
- Comprehensive valuation reports with sensitivity analyses
- Market data supporting royalty rates, discount rates, and other key assumptions
- Management interviews and internal documents supporting revenue projections and attrition assumptions
- Third-party valuation specialist reports (increasingly expected by auditors for material acquisitions)
In 2025, audit firms have intensified their scrutiny of PPA, particularly for intangible assets exceeding 15% of purchase price. The Big Four firms now routinely engage their internal valuation specialists for all acquisitions exceeding $100 million in enterprise value, and many require external valuation specialists for acquisitions exceeding $500 million.
08 Industry-Specific Considerations
Technology and Software
Technology acquisitions present unique challenges due to rapid obsolescence and the difficulty in separating technology from workforce. Customer relationships in SaaS businesses typically show 5-10% annual attrition but command premium valuations due to recurring revenue characteristics. Developed technology useful lives typically range from 3-7 years, reflecting rapid innovation cycles.
Pharmaceutical and Life Sciences
These transactions often involve substantial IPR&D, with valuations heavily dependent on probability-adjusted cash flows. Regulatory approval probabilities typically range from 10-20% for Phase I assets, 30-50% for Phase II, and 60-80% for Phase III. Marketed product intangibles (trade names, regulatory approvals) often have useful lives of 10-20 years, reflecting patent protection periods.
Consumer and Retail
Brand value dominates these transactions, often representing 35-50% of total intangible value. Customer relationships may be less significant in B2C contexts where brand drives purchasing decisions. Useful lives for consumer brands typically range from 15-25 years for established brands, 5-10 years for fashion or trend-dependent brands.
09 The Measurement Period and Subsequent Adjustments
IFRS 3 provides a measurement period—not exceeding one year from the acquisition date—during which the acquirer may retrospectively adjust provisional amounts recognized. This period allows for completion of the PPA when initial accounting is incomplete. In practice, most acquirers finalize PPA within 6-9 months, though complex transactions may utilize the full 12-month period.
Adjustments during the measurement period must be distinguished from errors and changes in estimates. Only new information about facts and circumstances that existed at the acquisition date can result in measurement period adjustments. Post-acquisition events require prospective treatment.
10 Looking Forward: Trends and Implications
As we progress through 2025-2026, several trends are reshaping PPA practice. First, artificial intelligence and machine learning assets are creating new identification and valuation challenges. These assets often blur the lines between technology, data, and assembled workforce, requiring careful analysis to determine appropriate recognition and measurement.
Second, environmental, social, and governance (ESG) considerations are increasingly influencing valuations. Sustainability-related intangibles—including carbon credits, renewable energy certificates, and ESG ratings—are appearing more frequently in PPA analyses, though consensus on valuation methodologies remains elusive.
Third, regulatory scrutiny continues to intensify. The International Valuation Standards Council (IVSC) has indicated that updated guidance on intangible asset valuation will be released in 2026, likely incorporating lessons learned from recent enforcement actions and audit quality reviews.
For practitioners navigating these complexities, the technical demands of PPA require both deep theoretical knowledge and practical judgment. The process cannot be reduced to mechanical application of formulas; it requires understanding the target's business model, competitive positioning, and value drivers. While the technical requirements of IFRS 3 are demanding, they serve the important purpose of providing transparency about the components of value in business combinations.
Modern valuation platforms like iValuate have evolved to support professionals in performing these sophisticated analyses efficiently, incorporating current market data, industry-specific assumptions, and technical methodologies that align with IFRS 3 requirements. As the M&A market continues its robust trajectory into 2026, the ability to execute rigorous, defensible PPA will remain a critical competency for corporate finance professionals, auditors, and valuation specialists alike.