Table of Contents10 sections
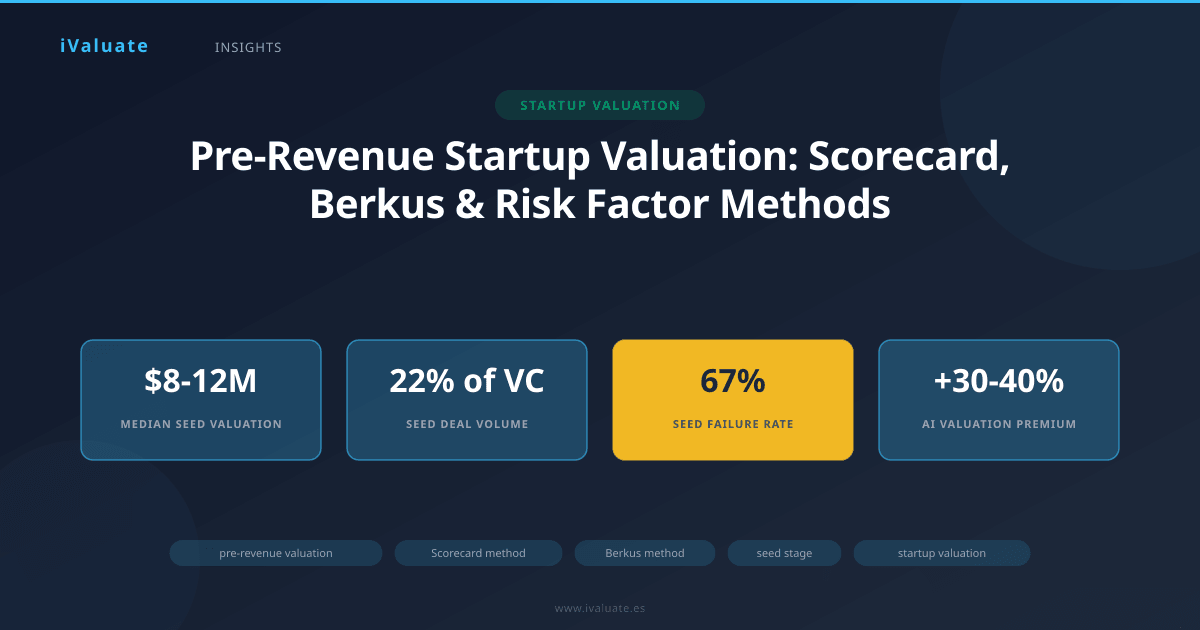
Valuing pre-revenue startups remains one of the most challenging exercises in corporate finance. Unlike established companies with historical financial performance, early-stage ventures lack the traditional metrics—revenue multiples, EBITDA, or discounted cash flows—that anchor conventional valuation methodologies. Yet in 2025, with global venture capital deployment exceeding $285 billion annually and seed-stage investments representing approximately 22% of total deal volume, the need for systematic pre-revenue valuation frameworks has never been more critical.
The absence of revenue does not mean the absence of value. Pre-revenue companies possess intellectual property, assembled teams, market positioning, prototype development, and strategic relationships—all tangible value drivers that sophisticated investors must quantify. Three methodologies have emerged as industry standards for seed-stage valuation: the Scorecard Method, the Berkus Method, and Risk Factor Summation. Each approach offers distinct advantages depending on the startup's stage, sector, and the investor's analytical preferences.
01 The Pre-Revenue Valuation Challenge
Traditional valuation methods fail at the earliest stages of company development. Discounted cash flow analysis requires projectable cash flows—a near impossibility when the product hasn't launched. Comparable company analysis struggles when truly comparable firms are private with undisclosed valuations. Asset-based approaches undervalue intangible assets like software code, brand positioning, or founder expertise that constitute the primary value in technology and service businesses.
According to 2025 data from the National Venture Capital Association, the median pre-money valuation for seed-stage companies in North America ranges from $8 million to $12 million, with significant sectoral variation. Enterprise SaaS startups command premiums of 35-50% over consumer applications, while deep-tech and biotech ventures often secure higher initial valuations due to intellectual property intensity and longer development timelines.
The valuation challenge intensifies when considering that approximately 67% of seed-stage startups will fail to reach Series A funding, and fewer than 10% will achieve meaningful exits. Investors must therefore balance the theoretical value of success against the statistical probability of failure—a calculation that requires structured, repeatable methodologies rather than pure intuition.
02 The Scorecard Valuation Method
Developed by Bill Payne and refined through thousands of angel investments, the Scorecard Method has become the most widely adopted pre-revenue valuation framework in North American angel networks. The methodology establishes a baseline valuation using regional comparables, then adjusts that baseline through a weighted scoring system across seven critical factors.
Establishing the Baseline
The Scorecard Method begins by identifying the average pre-money valuation for seed-stage companies in the target company's region and sector. In 2025, these baselines vary considerably:
- San Francisco Bay Area SaaS: $10-15 million baseline
- New York FinTech: $8-12 million baseline
- Austin/Denver Tech: $6-10 million baseline
- Secondary Markets: $4-8 million baseline
- Biotech/Life Sciences: $12-20 million baseline (reflecting longer development cycles)
These baselines reflect actual market transactions and serve as the neutral starting point before qualitative adjustments. Investors typically source baseline data from platforms like PitchBook, Crunchbase, or regional angel group databases.
The Seven Scoring Factors
Once the baseline is established, the Scorecard Method applies percentage adjustments across seven weighted factors:
1. Strength of the Management Team (0-30% weight)
The founding team receives the highest weighting, reflecting the venture capital truism that investors back people, not just ideas. Evaluation criteria include:
- Relevant industry experience and domain expertise
- Previous startup experience, especially successful exits
- Complementary skill sets across technical, commercial, and operational domains
- Educational pedigree and professional networks
- Full-time commitment versus part-time involvement
A strong team might receive a +25% adjustment, while a weak or incomplete team could warrant a -20% adjustment. In practice, 2025 data shows that teams with previous exit experience command valuation premiums averaging 40% higher than first-time founders.
2. Size of the Opportunity (0-25% weight)
Market size and growth trajectory significantly impact potential returns. Investors assess:
- Total addressable market (TAM) exceeding $1 billion
- Serviceable addressable market (SAM) and realistic penetration rates
- Market growth rates (markets growing >15% annually receive premiums)
- Market fragmentation and competitive intensity
A startup targeting a $50 billion growing market might receive a +20% adjustment, while one addressing a declining or sub-$500 million market could see a -15% adjustment.
3. Product/Technology (0-15% weight)
Even without revenue, product development stage matters:
- Functional prototype versus concept-stage
- Proprietary technology or defensible intellectual property
- Technical risk and development complexity
- Product-market fit evidence from beta users
4. Competitive Environment (0-10% weight)
Market positioning relative to existing and potential competitors:
- First-mover advantages or fast-follower strategies
- Barriers to entry and competitive moats
- Direct and indirect competition intensity
5. Marketing/Sales Channels (0-10% weight)
Go-to-market strategy and execution capability:
- Identified customer acquisition channels
- Sales pipeline development even without closed deals
- Strategic partnerships or distribution agreements
- Cost of customer acquisition relative to lifetime value projections
6. Need for Additional Investment (0-5% weight)
Capital efficiency and runway considerations:
- Clear path to next milestone with current raise
- Reasonable burn rate projections
- Likelihood of requiring bridge financing
7. Other Factors (0-5% weight)
Miscellaneous considerations including regulatory environment, social impact, or unique strategic value.
Calculation Example
Consider a Boston-based enterprise SaaS startup with a regional baseline of $9 million:
- Management Team: +20% (experienced team, one previous exit)
- Market Opportunity: +15% (large, growing market)
- Product/Technology: +10% (functional MVP with early adopters)
- Competitive Environment: 0% (moderate competition)
- Marketing/Sales: +5% (pilot customers identified)
- Capital Need: 0% (appropriate raise size)
- Other: +5% (strong advisory board)
Weighted adjustment: (0.30 × 1.20) + (0.25 × 1.15) + (0.15 × 1.10) + (0.10 × 1.00) + (0.10 × 1.05) + (0.05 × 1.00) + (0.05 × 1.05) = 1.1275
Final valuation: $9 million × 1.1275 = $10.15 million
The Scorecard Method's strength lies in its systematic approach and regional calibration. However, it requires accurate baseline data and can be subjective in factor scoring. Experienced angel groups often calibrate their scoring through portfolio retrospectives, adjusting weights based on which factors historically predicted success.
03 The Berkus Method
Created by veteran angel investor Dave Berkus, this method takes a more direct approach by assigning absolute dollar values to five key success factors. Rather than adjusting from a baseline, the Berkus Method builds valuation from zero by adding discrete increments for each value driver present in the business.
The Five Value Components
The original Berkus Method allocated up to $500,000 per factor, creating a maximum pre-revenue valuation of $2.5 million. However, inflation and market evolution have necessitated updates. In 2025, sophisticated investors typically use the following ranges:
1. Sound Idea (Basic Value): $0 to $1 million
The core business concept, including:
- Clarity and viability of the value proposition
- Problem-solution fit validation
- Intellectual property foundation
- Market timing and relevance
A truly innovative idea addressing a significant pain point in a large market might warrant $750,000 to $1 million, while a derivative concept in a crowded space might receive only $250,000 to $500,000.
2. Prototype (Reduces Technology Risk): $0 to $1.5 million
Tangible product development demonstrating technical feasibility:
- Functional minimum viable product (MVP)
- Technical architecture and scalability foundation
- User interface and experience design
- Integration capabilities and API development
A fully functional prototype with positive user feedback commands the high end of this range, while early-stage wireframes or concept demonstrations justify lower valuations.
3. Quality Management Team (Reduces Execution Risk): $0 to $1.5 million
The assembled human capital:
- Founder experience and track record
- Team completeness across key functions
- Advisory board quality and engagement
- Organizational culture and retention
This factor often receives the highest absolute values, as execution capability fundamentally determines outcomes. A team with complementary skills, relevant experience, and previous exits might justify the full $1.5 million, while incomplete or inexperienced teams receive significantly less.
4. Strategic Relationships (Reduces Market Risk): $0 to $1 million
External validation and market access:
- Pilot customers or letters of intent
- Distribution partnerships or channel agreements
- Technology partnerships or integration relationships
- Industry endorsements or awards
Even without revenue, signed pilot agreements or strategic partnerships demonstrate market validation and reduce go-to-market risk.
5. Product Rollout or Sales (Reduces Production Risk): $0 to $1 million
Market traction indicators:
- Beta users or early adopters
- Product-market fit signals
- User engagement metrics
- Waitlist or pre-orders (even if not yet monetized)
For truly pre-revenue companies, this category captures non-monetary traction—active users, engagement rates, or conversion funnel performance that predicts future monetization.
Calculation Example
Consider a fintech startup developing AI-powered personal finance tools:
- Sound Idea: $800,000 (addresses clear pain point in large market)
- Prototype: $1,200,000 (functional app with positive user testing)
- Management Team: $1,400,000 (experienced fintech founders, strong technical team)
- Strategic Relationships: $600,000 (partnership discussions with two banks, no signed agreements)
- Product Rollout: $700,000 (2,500 beta users, 40% weekly active usage)
Total Berkus Valuation: $4.7 million
The Berkus Method's advantages include simplicity, speed, and reduced subjectivity compared to purely qualitative assessments. However, it can undervalue companies in high-valuation environments and doesn't naturally adjust for regional or sectoral differences. Many investors use Berkus as a floor valuation, then apply market-based adjustments for competitive situations or hot sectors.
Key Insight: The Berkus Method works best for very early-stage companies (pre-seed to seed) and provides a useful sanity check against other methodologies. When Scorecard and Berkus valuations diverge significantly, it often signals the need for deeper due diligence into specific risk factors.
04 Risk Factor Summation Method
The Risk Factor Summation (RFS) approach, popularized by the Ohio TechAngels group, provides the most granular risk assessment of the three methodologies. Like the Scorecard Method, RFS begins with a baseline valuation but applies adjustments based on twelve specific risk categories rather than broad success factors.
The Twelve Risk Categories
Each risk factor receives a rating on a five-point scale:
- +2: Very positive, significantly reduces risk
- +1: Positive, somewhat reduces risk
- 0: Neutral, average risk for stage and sector
- -1: Negative, somewhat increases risk
- -2: Very negative, significantly increases risk
Each point typically translates to a $250,000 adjustment (though this can be calibrated based on baseline valuation size). The twelve risk categories are:
1. Management Risk
Team experience, completeness, and commitment. Factors include founder track records, skill complementarity, and full-time dedication.
2. Stage of the Business
Development progress relative to typical timelines. A company further along than expected for its funding stage receives positive adjustments.
3. Legislation/Political Risk
Regulatory environment and policy dependencies. Healthcare, fintech, and cannabis startups face elevated regulatory risk, while B2B SaaS typically rates neutral.
4. Manufacturing Risk
Production complexity and supply chain dependencies. Software companies rate positively; hardware and biotech face higher manufacturing risk.
5. Sales and Marketing Risk
Go-to-market clarity and customer acquisition feasibility. Companies with proven acquisition channels or existing pipelines rate positively.
6. Funding/Capital Raising Risk
Likelihood of securing follow-on funding. Companies in hot sectors with strong investor interest receive positive ratings.
7. Competition Risk
Competitive intensity and market positioning. First movers in fragmented markets rate positively; late entrants facing entrenched competitors rate negatively.
8. Technology Risk
Technical feasibility and development complexity. Proven technology stacks rate positively; unproven or cutting-edge approaches increase risk.
9. Litigation Risk
IP disputes, regulatory actions, or contractual exposures. Clean IP and no pending litigation rate positively.
10. International Risk
Cross-border operations, currency exposure, or international expansion requirements. Domestic-focused businesses rate neutrally.
11. Reputation Risk
Brand perception, founder reputation, or controversial business models. Positive press and founder credibility rate favorably.
12. Potential Lucrative Exit
Acquisition interest and exit pathway clarity. Companies in consolidating industries with clear strategic buyers rate positively.
Calculation Example
Using a $10 million baseline for a cybersecurity SaaS startup:
- Management Risk: +1 (experienced team, one gap in sales leadership)
- Stage of Business: +1 (ahead of schedule on product development)
- Legislation/Political Risk: 0 (neutral regulatory environment)
- Manufacturing Risk: +2 (pure software, no manufacturing)
- Sales and Marketing Risk: 0 (clear strategy, unproven execution)
- Funding/Capital Risk: +1 (strong investor interest in cybersecurity)
- Competition Risk: -1 (several established competitors)
- Technology Risk: +1 (proven technology stack)
- Litigation Risk: 0 (no current issues)
- International Risk: 0 (US-focused initially)
- Reputation Risk: +1 (positive early press coverage)
- Potential Exit: +1 (active M&A in sector)
Total Risk Score: +7
Valuation Adjustment: +$1.75 million
Final Valuation: $11.75 million
The Risk Factor Summation method excels in its comprehensive risk assessment and documentation. The twelve-factor framework forces systematic consideration of diverse risk dimensions that might otherwise be overlooked. However, the method can be time-consuming and requires calibrated judgment across multiple dimensions. It works best when multiple investors or investment committee members independently score factors, then reconcile differences through discussion.
05 Comparative Analysis and Method Selection
Each methodology offers distinct advantages depending on context, investor sophistication, and startup characteristics. In practice, experienced investors often employ multiple methods as cross-validation.
When to Use Each Method
Scorecard Method: Best for angel groups and early-stage VCs making numerous seed investments within a defined geography. The regional baseline calibration and weighted factors align well with portfolio approaches. Particularly effective when robust comparable data exists.
Berkus Method: Optimal for very early-stage companies (pre-seed to seed) and situations requiring rapid valuation estimates. Works well for initial screening and provides useful floors in negotiation. Less effective for later-stage pre-revenue companies or those in high-valuation environments.
Risk Factor Summation: Ideal for investment committees requiring detailed risk documentation and consensus-building. The granular risk assessment supports thorough due diligence and creates clear documentation for investment decisions. Most time-intensive but provides the richest analytical framework.
Real-World Application: Case Studies
Case Study 1: Enterprise AI Platform (2024)
A Boston-based enterprise AI startup sought seed funding with no revenue but a functional product and three pilot customers. The founding team included two MIT PhDs and a former enterprise software sales VP.
- Scorecard Method: $9M baseline × 1.18 adjustment = $10.6M
- Berkus Method: $4.8M (strong team and prototype, moderate relationships)
- Risk Factor Summation: $9M baseline + $2.0M adjustment = $11.0M
The investors ultimately valued the company at $10.5 million, reflecting the convergence of Scorecard and RFS methods while recognizing that Berkus undervalued the enterprise opportunity. The company raised $2.5 million at this valuation.
Case Study 2: Consumer HealthTech App (2025)
A Denver-based consumer health application with 15,000 beta users but no monetization strategy sought angel funding.
- Scorecard Method: $7M baseline × 0.95 adjustment = $6.65M (penalized for monetization uncertainty)
- Berkus Method: $3.9M (good traction but team gaps)
- Risk Factor Summation: $7M baseline - $0.75M adjustment = $6.25M (regulatory and monetization risks)
The valuation range of $6.25M to $6.65M reflected consensus around execution and monetization risks. The company ultimately raised at $6 million pre-money, below the calculated range due to competitive fundraising dynamics.
Case Study 3: Deep Tech Hardware (2025)
A Silicon Valley robotics company with breakthrough sensor technology but 18-month development timeline sought institutional seed funding.
- Scorecard Method: $12M baseline × 1.25 adjustment = $15.0M
- Berkus Method: $5.2M (strong IP and team, early-stage prototype)
- Risk Factor Summation: $12M baseline + $1.5M adjustment = $13.5M
The wide range between Berkus and other methods reflected the methodology's limitations for capital-intensive deep tech. Investors valued the company at $14 million, recognizing the IP value and team quality while acknowledging extended development timelines.
06 Market Context and Trends (2025-2026)
The pre-revenue valuation landscape continues evolving in response to broader market dynamics. Several trends are reshaping how investors approach seed-stage valuations:
Valuation Compression: Following the 2022-2023 correction, seed-stage valuations have stabilized but remain 15-20% below 2021 peaks. Investors now emphasize capital efficiency and clear paths to profitability over pure growth narratives.
Geographic Arbitrage: The gap between primary markets (San Francisco, New York) and secondary markets (Austin, Denver, Miami) has narrowed from 40-50% to 25-30% as remote work enables distributed teams and investors seek value outside traditional hubs.
Sector Premiums: AI-enabled companies command 30-40% valuation premiums over comparable non-AI businesses, though investors increasingly scrutinize whether AI represents core differentiation or feature-level enhancement. Climate tech and healthcare IT also command premiums reflecting policy tailwinds and demographic trends.
Traction Thresholds: While these methods address pre-revenue companies, investors increasingly expect meaningful non-revenue traction—user counts, engagement metrics, or pilot agreements—that would have been exceptional five years ago. The bar for "pre-revenue" has risen substantially.
Follow-on Capacity: Seed investors now place greater emphasis on follow-on funding risk (Risk Factor Summation category 6), recognizing that Series A bar heights have increased. Companies must demonstrate clearer paths to $1-2 million ARR to secure institutional Series A funding.
07 Practical Implementation Considerations
Successful application of these methodologies requires several practical considerations beyond mechanical calculation:
Multiple Method Validation: Professional investors rarely rely on a single methodology. Applying all three methods and examining convergence or divergence provides valuable insights. Significant divergence often signals the need for deeper due diligence into specific risk or value factors.
Baseline Calibration: Both Scorecard and Risk Factor Summation methods depend on accurate baselines. Investors should maintain databases of comparable transactions, updated quarterly, segmented by geography, sector, and stage. Platforms like PitchBook, Crunchbase, and specialized databases provide essential market intelligence.
Documentation and Consistency: Investment committees benefit from standardized scoring templates and documented rationales for each factor assessment. This documentation supports portfolio analysis, helps calibrate future valuations, and provides accountability for investment decisions.
Founder Communication: When presenting valuations to founders, explaining the methodology builds credibility and facilitates negotiation. Founders who understand the analytical framework are better positioned to address investor concerns and strengthen weak factors.
Dynamic Reassessment: Pre-revenue valuations should be revisited as new information emerges during due diligence. A company that initially scored neutrally on management might warrant positive adjustment after reference calls reveal exceptional founder reputation. Conversely, competitive intelligence might necessitate downward revision.
Professional Practice Note: Leading angel groups and seed funds typically assign two investment committee members to independently score companies using the chosen methodology, then reconcile differences through structured discussion. This process reduces individual bias and improves calibration across the portfolio.
08 Limitations and Complementary Approaches
While these three methodologies represent industry best practices for pre-revenue valuation, they have inherent limitations:
Subjectivity: All three methods involve qualitative judgment in factor assessment. Two experienced investors may reasonably disagree on whether a management team warrants +15% or +25% adjustment. Structured processes and multiple evaluators mitigate but don't eliminate this subjectivity.
Backward-Looking Baselines: Scorecard and RFS methods rely on historical comparables that may not reflect current market conditions. During rapid market shifts (like 2022-2023), baseline data lags reality by 6-12 months.
Binary Outcomes: These methods produce point estimates, but startup outcomes follow power law distributions. A more sophisticated approach might generate probability-weighted scenarios, though this requires additional complexity.
Sector Limitations: The methods work best for technology and service businesses. Biotech, medical devices, and other capital-intensive sectors with binary regulatory outcomes may require specialized approaches incorporating option value and probability-weighted milestones.
Sophisticated investors often complement these methods with:
- Venture Capital Method: Working backward from projected exit values and required returns to calculate current valuation
- First Chicago Method: Probability-weighted scenarios across success, sideways, and failure outcomes
- Option Pricing Models: For companies with significant technical or regulatory risk, treating the investment as an option on future value
09 The Role of Technology in Pre-Revenue Valuation
The complexity and data requirements of systematic pre-revenue valuation have driven adoption of specialized analytical tools. Modern valuation platforms enable investors to:
- Access real-time comparable transaction databases with granular filtering
- Apply multiple methodologies simultaneously with automated calculations
- Maintain consistent scoring templates across investment committees
- Track portfolio company progression against initial valuations
- Generate professional valuation reports for limited partners and stakeholders
Professional-grade platforms like iValuate have become essential infrastructure for active angel investors and seed funds, reducing analysis time from hours to minutes while improving consistency and documentation. As the volume of seed-stage opportunities continues growing—with over 15,000 institutional seed investments annually in North America alone—systematic, technology-enabled approaches separate sophisticated investors from those relying purely on intuition.
10 Conclusion: Disciplined Frameworks for Uncertain Outcomes
Pre-revenue startup valuation will never achieve the precision of public company analysis. The inherent uncertainty of early-stage ventures, the absence of historical financial performance, and the binary nature of startup outcomes ensure that valuation remains as much art as science. However, the Scorecard Method, Berkus Method, and Risk Factor Summation approach provide disciplined frameworks that transform intuitive judgment into systematic analysis.
The most successful seed-stage investors combine these methodologies with deep domain expertise, extensive networks for due diligence, and portfolio-level thinking about risk and return. They recognize that individual valuations matter less than portfolio construction, but that systematic valuation discipline improves both deal selection and negotiation outcomes.
As we progress through 2025 and into 2026, several forces will continue reshaping pre-revenue valuation: artificial intelligence's impact on product development timelines, the maturation of secondary markets, increasing capital efficiency expectations, and the growing sophistication of founder understanding of valuation methodologies. Investors who master these frameworks while remaining adaptable to market evolution will be best positioned to identify and capture returns from the next generation of transformative companies.
For professionals managing active deal flow—whether angel groups evaluating 50+ opportunities annually or venture funds assessing hundreds of potential investments—the combination of rigorous methodology and efficient technology infrastructure has become non-negotiable. Tools like iValuate enable this combination, allowing investors to apply institutional-quality analysis at scale while maintaining the speed required in competitive seed-stage markets. The future of pre-revenue valuation lies not in replacing judgment with formulae, but in augmenting experienced judgment with systematic frameworks and data-driven insights.