Table of Contents9 sections
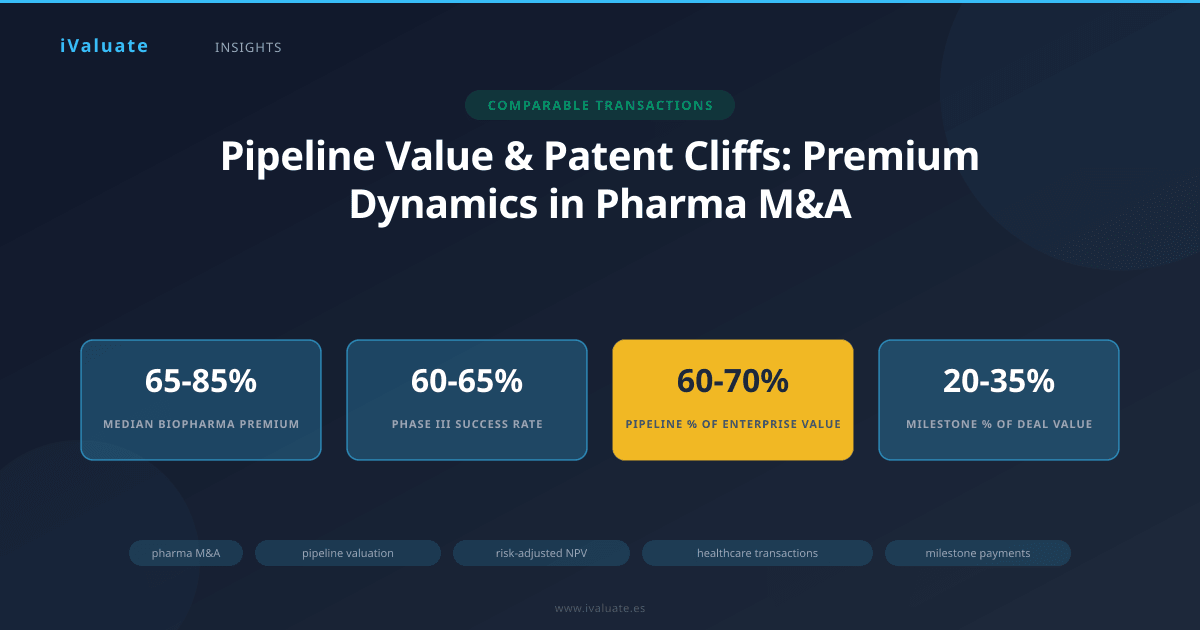
The healthcare and pharmaceutical M&A landscape has undergone a fundamental transformation in how acquirers value targets and justify premium pricing. Unlike traditional industries where multiples of EBITDA or revenue dominate valuation discussions, pharma deals increasingly hinge on the probabilistic value of drug pipelines, the looming threat of patent cliffs, and sophisticated risk-adjusted financial modeling. In 2025-2026, we've witnessed median acquisition premiums in the biopharma sector reaching 65-85% over pre-announcement trading prices—substantially higher than the 25-35% typical in other industries.
This premium differential isn't arbitrary. It reflects the unique economics of pharmaceutical assets: binary clinical trial outcomes, regulatory approval uncertainties, patent expiration events that can eliminate 80-90% of a product's revenue within 18 months, and pipeline candidates that may represent 60-70% of a target's enterprise value despite generating zero current revenue. For valuation professionals, M&A advisors, and corporate development teams, understanding these dynamics isn't merely academic—it's essential for structuring defensible valuations, negotiating deal terms, and advising boards on strategic transactions.
01 The Structural Drivers of Healthcare M&A Premiums
Healthcare M&A premiums consistently exceed those in other sectors for several interconnected reasons rooted in the industry's unique risk-return profile. The pharmaceutical business model concentrates enormous value in intangible assets—specifically, intellectual property protecting novel compounds and the clinical data supporting their efficacy and safety. When a major pharmaceutical company acquires a biotech firm, it's typically purchasing future cash flows that won't materialize for 3-7 years, protected by patents that may have 8-12 years of exclusivity remaining.
Consider the typical financial profile of an acquisition target in the biotech space. A company with $150 million in current revenue from one marketed product might command a $4-5 billion acquisition price—an eye-watering 27-33x revenue multiple. This valuation becomes rational only when you incorporate the pipeline: perhaps three Phase III assets with 60-70% probability of approval, two Phase II candidates at 30-40% probability, and a platform technology that could generate multiple future programs. The marketed product might represent only 15-20% of the enterprise value, with the remaining 80-85% attributable to pipeline potential.
Patent Cliff Dynamics and Defensive Acquisitions
Patent cliffs create acute pressure on pharmaceutical companies to replenish revenue through M&A. When a blockbuster drug loses exclusivity, generic competition typically captures 80-90% of prescription volume within 12-18 months, while pricing on the branded product collapses by 85-95%. For a company with $8 billion in annual revenue from a single product facing patent expiration, this represents a $6.8-7.2 billion revenue hole that must be filled.
This dynamic drove significant M&A activity in 2024-2025. Large-cap pharma companies facing collective patent cliffs exceeding $150 billion in at-risk revenue through 2028 have been aggressive acquirers. The urgency of these situations often translates directly into premium pricing. An acquirer facing a $5 billion revenue cliff in 24 months will rationally pay a substantial premium for assets that can partially offset that loss, even if the standalone DCF valuation suggests a lower price. The strategic value—measured as the present value of avoiding revenue decline and maintaining growth trajectories that support equity valuations—can justify premiums of 40-60% above intrinsic value.
02 Risk-Adjusted NPV: The Foundation of Pipeline Valuation
The cornerstone methodology for valuing pharmaceutical pipelines is risk-adjusted net present value (rNPV), which applies probability weighting to each development stage and commercial outcome. Unlike traditional DCF analysis that models a single scenario, rNPV explicitly incorporates the binary nature of drug development: a Phase III asset either succeeds (generating billions in NPV) or fails (generating zero).
The rNPV framework begins with probability of technical and regulatory success (PTRS) estimates for each development stage. Industry data from 2020-2024 shows the following median success rates: Phase I to approval (10-12%), Phase II to approval (20-25%), Phase III to approval (60-65%), and regulatory filing to approval (90-92%). These probabilities vary significantly by therapeutic area—oncology Phase II success rates hover around 15-18%, while vaccines achieve 40-45%.
Constructing an rNPV Model
A rigorous rNPV analysis for a pipeline asset involves several critical components. First, project peak sales potential based on epidemiology (patient population), market penetration assumptions (typically 10-25% for a new entrant in a competitive market, potentially 40-60% for a first-in-class therapy), and pricing (which varies from $50,000-$150,000 annually for specialty medications to $500,000-$2 million for rare disease treatments). Second, model the revenue ramp from launch through patent expiration, typically assuming 3-5 years to peak sales. Third, apply operating margins that reflect manufacturing costs, sales and marketing expenses, and royalty obligations—usually 70-85% for specialty pharmaceuticals.
Fourth, estimate remaining development costs by phase, including clinical trial expenses ($50-150 million for Phase III programs in common indications, $200-400 million for complex oncology or rare disease trials), regulatory filing costs ($5-15 million), and commercial launch investments ($100-300 million for sales force build-out and market development). Fifth, apply appropriate discount rates that reflect both the time value of money and the risk profile of the asset—typically 10-12% for marketed products, 12-15% for late-stage pipeline assets, and 15-20% for early-stage programs.
Finally, and most critically, multiply the resulting NPV by the probability of success. A Phase III oncology asset with an unadjusted NPV of $3 billion and a 60% probability of approval has an rNPV of $1.8 billion. This probability adjustment is what distinguishes pharmaceutical valuation from other industries and drives the complexity of deal pricing.
Real-World Application: Oncology Asset Valuation
Consider a hypothetical but representative example from recent M&A activity. A biotech company has a Phase III asset targeting non-small cell lung cancer (NSCLC) in a specific biomarker-defined patient population. Epidemiology suggests 45,000 diagnosed patients annually in the US and EU5 markets. Clinical data indicates the therapy extends progression-free survival by 5.2 months versus standard of care—a meaningful but not transformative benefit.
The valuation analysis projects peak sales of $1.8 billion (assuming 35% market penetration at $115,000 annual treatment cost), reached in year 4 post-launch. With 85% operating margins, 8 years of exclusivity remaining at peak sales, and $180 million in remaining development costs, the unadjusted NPV at a 12% discount rate is approximately $4.2 billion. Applying a 62% probability of approval (slightly above median for Phase III oncology given the strong Phase II data) yields an rNPV of $2.6 billion.
However, the acquirer must also consider additional value drivers and risks. Potential label expansion into earlier-line therapy could add $800 million-$1.2 billion in rNPV (probability-adjusted for both approval and market uptake). Conversely, competitive threats from three other programs in Phase II/III development might compress market share assumptions by 15-25%, reducing rNPV by $400-650 million. The final enterprise value range of $2.3-3.1 billion reflects these scenario analyses—and in a competitive auction environment, the ultimate price of $3.4 billion (representing a 75% premium to the pre-announcement stock price) incorporated both strategic value to the acquirer and competitive tension among bidders.
03 Milestone Payments and Contingent Value Rights
The inherent uncertainty in pharmaceutical valuations has driven widespread adoption of contingent consideration structures that align payment with value realization. Milestone payments and contingent value rights (CVRs) serve dual purposes: they bridge valuation gaps between buyers and sellers, and they shift risk allocation in ways that can make deals economically feasible when fixed-price transactions would fail.
Milestone structures typically tie payments to specific development and commercial achievements. A common framework includes regulatory milestones (FDA approval, EU approval, approval in specific indications), development milestones (initiation or completion of clinical trials, achievement of enrollment targets), and commercial milestones (first commercial sale, achievement of specific revenue thresholds such as $500 million, $1 billion, or $2 billion in annual sales).
Structuring Effective Milestone Provisions
In the 2024-2025 M&A environment, milestone payments have comprised 20-35% of total consideration in biotech acquisitions, with individual milestone values ranging from $50 million to over $1 billion for blockbuster potential assets. The structure of these provisions significantly impacts their economic value and the incentives they create.
Regulatory milestones are typically binary and relatively near-term, making them easier to value. A $300 million payment contingent on FDA approval of a Phase III asset with 65% probability of success has a present value of approximately $195 million (assuming 18 months to approval and a 10% discount rate). These milestones transfer technical and regulatory risk from buyer to seller—if the asset fails, the buyer avoids the payment; if it succeeds, the seller participates in the upside.
Commercial milestones are more complex to value because they depend on both approval and market performance. A $500 million payment triggered by achieving $2 billion in annual sales requires the asset to both gain approval and capture significant market share. The probability-adjusted value might be only $150-200 million if the combined probability of approval and commercial success is 30-40%. These structures are particularly valuable when buyer and seller have divergent views on commercial potential—the seller's optimism is rewarded if proven correct, while the buyer's downside is protected if the asset underperforms.
Contingent Value Rights in Practice
CVRs represent a more sophisticated approach to contingent consideration, typically structured as tradeable securities that entitle holders to payments upon achievement of specified milestones. Unlike earnouts that remain contractual obligations between buyer and seller, CVRs can be separated from the underlying equity and traded independently, providing liquidity to former shareholders while maintaining the contingent structure.
A notable example from 2024 involved a $6.2 billion acquisition where $1.8 billion of the consideration was structured as CVRs tied to three milestones: FDA approval of the lead asset ($600 million), EU approval ($400 million), and achievement of $1.5 billion in combined annual sales from two products ($800 million). The CVRs traded initially at $0.72 per right (72% of face value), reflecting market participants' collective probability assessment of milestone achievement. As clinical data readouts and regulatory interactions provided new information, CVR pricing fluctuated between $0.58 and $0.91, demonstrating how the market continuously re-prices development risk.
From a valuation perspective, CVRs introduce additional complexity because their value depends not only on milestone probabilities but also on market liquidity, information asymmetry, and investor risk preferences. The discount between CVR trading price and probability-adjusted fair value (often 15-30%) reflects illiquidity premiums and the market's risk aversion to binary outcomes.
04 Therapeutic Area Variations in Valuation Multiples
Not all healthcare M&A is created equal—valuation multiples and premium dynamics vary substantially across therapeutic areas, reflecting differences in development risk, commercial potential, competitive intensity, and strategic importance to acquirers.
Oncology assets command premium valuations due to high unmet need, premium pricing potential, and accelerated regulatory pathways. Median acquisition multiples for oncology-focused biotechs with marketed products reached 8.5-11.0x revenue in 2024-2025, compared to 4.5-6.5x for primary care-focused companies. Pipeline-stage oncology companies with Phase III assets have traded at enterprise values of $2-4 billion despite zero revenue, justified by peak sales potential exceeding $3-5 billion for successful programs.
Rare disease and gene therapy assets represent the opposite end of the spectrum—ultra-high pricing ($1-3 million per patient for one-time gene therapies) applied to small patient populations (often 2,000-10,000 patients globally). These assets can generate $400-800 million in peak sales with minimal marketing expense and limited competitive threat, producing exceptional operating margins of 88-92%. Acquisition multiples for rare disease companies with approved therapies have exceeded 15-20x revenue, while pipeline-stage companies with Phase II data have commanded $1.5-2.5 billion valuations.
Neuroscience and Immunology: The Strategic Premium
Neuroscience assets, particularly in Alzheimer's disease and other neurodegenerative conditions, carry both exceptional commercial potential and elevated development risk. The Phase III failure rate in neuroscience exceeds 70%, substantially higher than the 35-40% overall Phase III failure rate. This risk profile depresses rNPV calculations—a neuroscience Phase III asset with $8 billion peak sales potential might have an rNPV of only $1.2-1.6 billion due to the 25-30% probability of success.
However, strategic considerations often override pure rNPV analysis. Large pharmaceutical companies view leadership in neuroscience as strategically essential, given the massive patient populations (55 million dementia patients globally) and the reputational benefits of breakthrough therapies. This strategic imperative drove several 2024-2025 transactions where acquirers paid 50-70% premiums to rNPV-derived valuations, effectively pricing in strategic optionality and platform value beyond the individual asset.
Immunology and inflammation assets benefit from well-understood biology, established regulatory pathways, and large commercial markets. Acquisitions in this space typically trade at 6-9x revenue for marketed products, with pipeline assets valued at 40-60% of oncology comparables due to lower risk profiles (Phase III success rates of 70-75% in immunology versus 60-65% in oncology).
05 The Role of Platform Technologies and Data Assets
An emerging dimension of healthcare M&A valuation involves platform technologies—proprietary capabilities that can generate multiple drug candidates rather than single assets. Antibody discovery platforms, RNA therapeutics technologies, and AI-driven drug design capabilities represent this category. Valuing platforms requires extending rNPV methodology to portfolio-level analysis, incorporating probabilities for both technical success and the number of viable programs the platform can generate.
A platform capable of generating 8-12 clinical-stage programs over 5-7 years, with each program having $800 million-$1.5 billion in rNPV potential, might justify a $4-6 billion valuation even if only 1-2 programs are currently in clinical development. The challenge lies in assessing platform productivity (programs per year), technical success rates (which may differ from industry averages for novel modalities), and the competitive sustainability of the platform advantage.
Real-world data (RWD) and artificial intelligence capabilities have also become valuation drivers in healthcare M&A. Companies with proprietary patient databases, electronic health record integrations, or AI algorithms for patient identification and trial optimization command premiums of 25-40% over comparable companies without these assets. The rationale: these capabilities accelerate development timelines (reducing costs and extending effective patent life), improve trial success rates (by better patient selection), and enable more precise commercial targeting.
06 Valuation Challenges and Professional Practice Considerations
Healthcare M&A valuation presents unique challenges that require specialized expertise and sophisticated analytical frameworks. The probabilistic nature of pipeline value means that small changes in assumptions—a 5-percentage-point shift in probability of approval, a 15% adjustment to peak sales estimates, or a 2-percentage-point change in discount rate—can swing enterprise value by hundreds of millions or billions of dollars.
Sensitivity analysis becomes not merely good practice but essential. A rigorous valuation opinion for a pharmaceutical transaction should present value ranges across multiple scenarios: base case, upside case (perhaps 75th percentile assumptions on probability and commercial potential), and downside case (25th percentile assumptions). The spread between these scenarios often exceeds 100-150% of the base case value, reflecting the genuine uncertainty inherent in these assets.
Comparable Transaction Analysis in Pharma M&A
Comparable transaction analysis requires careful screening and adjustment in healthcare M&A. Unlike industrial sectors where revenue and EBITDA multiples from comparable deals provide reliable benchmarks, pharmaceutical transactions demand comparison across multiple dimensions: development stage, therapeutic area, mechanism of action, competitive positioning, clinical differentiation, and patent life.
A transaction involving a Phase III oncology asset with breakthrough therapy designation, first-in-class status, and 12 years of patent life cannot be directly compared to a Phase III oncology deal for a follow-on therapy with 7 years of exclusivity, even if both target the same indication. The former might trade at 4-5x the rNPV multiple of the latter due to competitive positioning and duration of commercial opportunity.
Professional valuation practice in this context requires building databases of transactions with detailed asset characteristics, normalizing for deal structure (upfront versus milestone consideration), and applying regression analysis or other statistical techniques to isolate the impact of specific value drivers. Leading M&A advisory practices maintain proprietary databases of 200-300 pharmaceutical transactions with granular asset-level data to support this analysis.
07 Regulatory and Tax Considerations in Deal Structuring
The structure of healthcare M&A transactions carries significant tax and regulatory implications that impact net value to both parties. Asset purchases versus stock purchases create different tax treatments—asset deals allow the buyer to step up the tax basis of acquired assets (generating future tax deductions) but may trigger immediate tax liability for sellers. In pharmaceutical M&A, where intangible assets comprise 75-90% of value, this step-up can be worth 15-25% of purchase price in present value terms.
Cross-border transactions introduce additional complexity. Many biotech targets are domiciled in tax-efficient jurisdictions (Ireland, Switzerland, Singapore) while maintaining operational presence in the US and EU. Acquirers must structure deals to optimize tax treatment of future royalty and profit flows, often using hybrid structures that combine cash consideration, stock swaps, and contingent payments to minimize tax leakage.
Regulatory considerations also shape deal structure. Antitrust review in the pharmaceutical sector has intensified in 2024-2025, with regulatory authorities scrutinizing not only current market overlap but also potential future competition from pipeline assets. Deals that combine companies with overlapping late-stage programs may face divestiture requirements or behavioral remedies (commitments to license certain assets or maintain pricing constraints), which directly impact valuation by reducing synergy capture or imposing ongoing costs.
08 The Future of Healthcare M&A Valuation
Looking ahead to 2026 and beyond, several trends will reshape healthcare M&A valuation practices. First, the maturation of cell and gene therapies will require new valuation frameworks that account for one-time curative treatments with $2-4 million price points and complex reimbursement structures involving outcomes-based payments spread over 3-5 years. Traditional rNPV models must be adapted to incorporate reimbursement risk and the time value of deferred payments.
Second, artificial intelligence and machine learning in drug discovery will create valuation challenges around platform technologies that may generate dozens of programs but with uncertain timelines and success rates. Valuing these platforms will require Monte Carlo simulation approaches that model portfolio-level outcomes across thousands of scenarios, incorporating correlations between programs and learning curves in platform productivity.
Third, increasing integration of diagnostics and therapeutics (companion diagnostics, liquid biopsy technologies) will require valuation models that capture the synergistic value of combined offerings—where the diagnostic enables patient selection that improves therapeutic outcomes and justifies premium pricing. These integrated valuations must model adoption curves for both components and the feedback loops between diagnostic uptake and therapeutic market penetration.
Fourth, heightened focus on environmental, social, and governance (ESG) factors will introduce new value considerations. Pharmaceutical companies with strong ESG profiles—particularly around access and pricing practices—may command premium valuations due to reduced regulatory risk and enhanced reputation, while companies with ESG vulnerabilities may face valuation discounts of 10-20%.
09 Conclusion: Navigating Complexity with Rigorous Methodology
Healthcare and pharmaceutical M&A valuation represents one of the most intellectually demanding domains in corporate finance, requiring deep therapeutic area knowledge, sophisticated probabilistic modeling, and nuanced judgment about scientific, regulatory, and commercial risks. The premium dynamics observed in this sector—with acquisition prices routinely exceeding 60-80% premiums and valuations reaching 25-35x revenue for pipeline-rich targets—reflect rational economic calculations about future value creation, not irrational exuberance.
For M&A advisors, corporate development professionals, and valuation specialists, success in this arena demands continuous learning about evolving science, regulatory frameworks, and commercial dynamics. It requires building robust analytical frameworks that incorporate risk-adjusted cash flows, probability-weighted scenarios, and sensitivity analysis across dozens of variables. And it requires the judgment to know when quantitative models provide reliable guidance and when qualitative factors—strategic fit, platform potential, competitive dynamics—should override pure financial analysis.
The tools and methodologies available to valuation professionals have advanced significantly in recent years. Platforms like iValuate now incorporate industry-specific templates for pharmaceutical rNPV analysis, comparable transaction databases with therapeutic area filters, and Monte Carlo simulation capabilities that enable rapid scenario testing. These technologies don't replace professional judgment—they enhance it, allowing practitioners to test more scenarios, incorporate more data, and deliver more defensible valuations in compressed timeframes.
As the pharmaceutical industry continues its evolution toward precision medicine, gene therapies, and AI-driven drug discovery, the valuation challenges will only intensify. The winners in this environment will be those who combine deep domain expertise with rigorous analytical frameworks, who understand both the science and the economics, and who can translate complex probabilistic analyses into clear strategic recommendations. For the foreseeable future, healthcare M&A will remain one of the most dynamic and intellectually rewarding areas of corporate valuation practice.