Table of Contents11 sections
In the current economic environment of 2025-2026, characterized by elevated interest rates, compressed valuations, and persistent supply chain volatility, operational restructuring has emerged as the primary value creation lever for distressed companies. Unlike financial engineering or balance sheet restructuring, operational turnarounds focus on fundamentally improving how a business generates cash flow—a critical distinction when traditional refinancing options remain constrained and stakeholders demand tangible performance improvements.
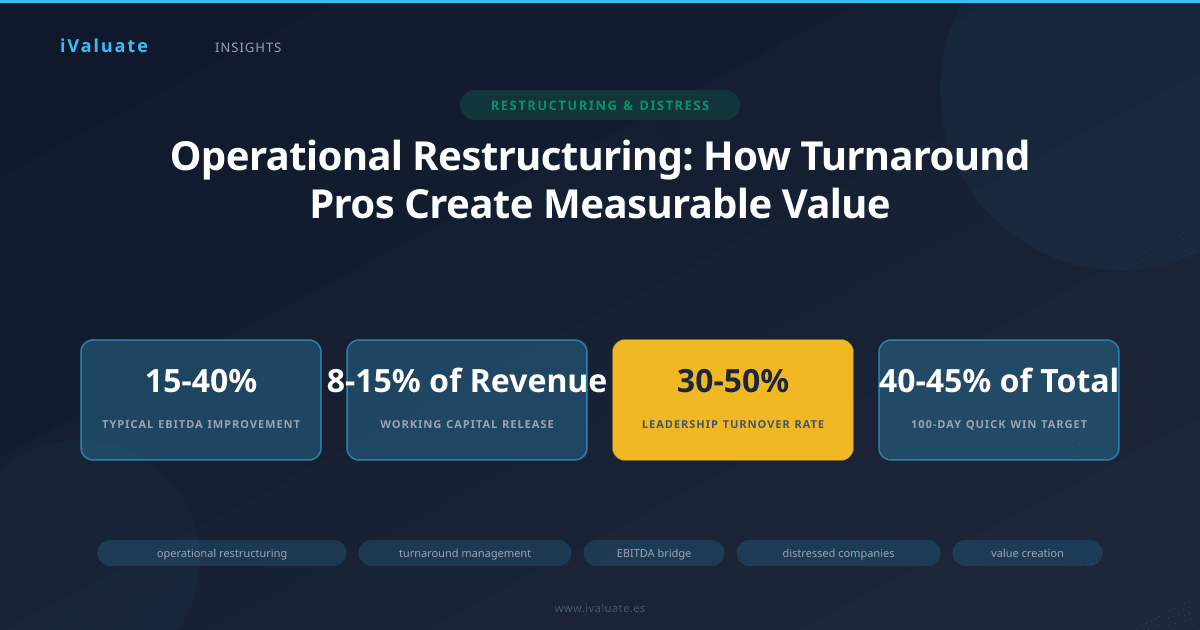
Turnaround professionals—whether interim executives, specialized consulting firms, or private equity operating partners—approach operational restructuring with a disciplined, data-driven methodology that typically delivers EBITDA improvements ranging from 15% to 40% within 12-18 months. This article examines the specific frameworks, analytical tools, and execution strategies that experienced practitioners deploy to create measurable value in distressed situations.
01 The Operational Restructuring Framework: Beyond Cost Cutting
The most sophisticated turnaround professionals recognize that sustainable value creation requires a holistic approach that extends far beyond simple headcount reduction. The operational restructuring framework encompasses five interconnected dimensions:
- Revenue stabilization and optimization: Identifying and protecting core revenue streams while eliminating unprofitable products, customers, or geographies
- Cost structure rationalization: Systematically reducing both fixed and variable costs while preserving operational capability
- Working capital optimization: Accelerating cash conversion through inventory reduction, receivables management, and payables extension
- Operational process improvement: Eliminating inefficiencies, reducing cycle times, and improving asset utilization
- Organizational effectiveness: Realigning talent, decision rights, and accountability structures to support the new operating model
In a recent mid-market manufacturing turnaround, this comprehensive approach generated $18.2 million in annual EBITDA improvement on a $120 million revenue base—a 15.2% margin expansion. The breakdown revealed that cost reduction contributed only 45% of the total improvement, with revenue optimization (28%), working capital efficiency (17%), and process improvements (10%) delivering the balance. This distribution underscores a critical insight: the most successful turnarounds create value across multiple dimensions simultaneously.
02 The EBITDA Bridge: Quantifying Value Creation
The EBITDA bridge serves as the central analytical tool for planning, tracking, and communicating operational restructuring initiatives. This waterfall analysis decomposes the journey from baseline EBITDA to target EBITDA into discrete, quantifiable components, creating transparency and accountability throughout the turnaround process.
A properly constructed EBITDA bridge typically includes the following elements:
Revenue Components
Volume/Mix Impact: Changes in unit volumes and product/customer mix, separated to understand underlying demand trends versus strategic portfolio decisions. In 2025-2026, many turnarounds face the challenge of distinguishing cyclical volume declines from structural market shifts—a critical determination that shapes strategic priorities.
Price Realization: Pricing actions, including both list price changes and discount/rebate optimization. Current market conditions have created opportunities for selective price increases in categories with limited substitutes, though execution requires careful customer segmentation and competitive intelligence.
Revenue Attrition: Deliberate elimination of unprofitable business, typically representing 5-15% of baseline revenue in comprehensive turnarounds. One industrial distribution company recently exited $22 million in revenue (18% of total) that was generating negative gross margins after fully-loaded costs—immediately improving EBITDA by $3.1 million.
Cost of Goods Sold Components
Direct Material Costs: Procurement savings from supplier renegotiation, specification changes, and volume consolidation. Experienced turnaround professionals typically achieve 8-15% reductions in material costs through systematic sourcing initiatives, with implementation timelines of 90-180 days.
Direct Labor Efficiency: Productivity improvements from process redesign, training, and incentive realignment. Manufacturing turnarounds commonly target 12-20% labor efficiency gains through lean manufacturing principles and standard work implementation.
Manufacturing Overhead: Fixed cost reduction through facility rationalization, maintenance optimization, and indirect labor reduction. This category often represents 20-30% of total cost reduction opportunity.
Operating Expense Components
Sales and Marketing: Optimization of sales force productivity, marketing spend effectiveness, and channel economics. Turnaround situations frequently reveal 30-40% of marketing expenditure generating minimal measurable return—low-hanging fruit for reallocation or elimination.
General and Administrative: Corporate overhead reduction through span-of-control optimization, shared services implementation, and discretionary spend elimination. G&A reduction targets typically range from 15-25% of baseline spend.
One-Time Restructuring Costs: Severance, facility closure costs, and contract termination fees. While these costs reduce near-term cash flow, they're essential for achieving the sustainable cost structure—experienced practitioners budget 0.8-1.2x the annual savings for one-time implementation costs.
Working Capital and Other Components
Working Capital Release: While not directly impacting EBITDA, working capital improvements are typically tracked alongside the EBITDA bridge due to their critical importance for cash generation. Turnarounds commonly target 15-25% reductions in net working capital as a percentage of revenue.
Other Income/Expense: Non-operating items including facility subleases, asset sales, and other adjustments.
The power of the EBITDA bridge lies in its granularity and accountability. Each component is assigned to a specific owner, with weekly tracking of actual results versus plan. In a recent business services turnaround, this discipline revealed that procurement savings were tracking 22% ahead of plan while sales productivity improvements were lagging by 31%—enabling rapid resource reallocation to address the shortfall.
03 Revenue Optimization: The Overlooked Value Driver
While cost reduction dominates turnaround narratives, revenue optimization often delivers superior returns on management time and capital invested. The key is distinguishing between revenue growth (typically unrealistic in distressed situations) and revenue optimization (maximizing profitability of existing revenue streams).
Customer and Product Profitability Analysis
Sophisticated turnaround professionals deploy activity-based costing or similar methodologies to understand true profitability at granular levels. This analysis consistently reveals surprising patterns:
- The bottom 20-30% of customers frequently destroy value after fully-loaded service costs
- 15-25% of SKUs generate 80-90% of gross profit
- Certain sales channels or geographies operate at structural disadvantages that cannot be overcome through operational improvement
A specialty chemicals manufacturer recently discovered that 18% of its customer base was generating negative gross margins after allocating technical service, logistics, and working capital costs. Exiting these relationships over six months reduced revenue by $31 million but improved EBITDA by $4.7 million while releasing $8.2 million in working capital—a powerful illustration of addition through subtraction.
Pricing Architecture Redesign
Distressed companies often exhibit pricing discipline erosion, with discounting authority dispersed throughout the organization and limited analytical rigor supporting pricing decisions. Turnaround professionals implement several high-impact pricing interventions:
Discount governance: Centralizing approval authority for discounts beyond defined thresholds, typically reducing average discount rates by 150-300 basis points within 60-90 days.
Price segmentation: Implementing differentiated pricing based on customer willingness-to-pay, competitive intensity, and service requirements rather than one-size-fits-all approaches.
Surcharge mechanisms: Introducing transparent surcharges for fuel, raw materials, or expedited service—converting cost volatility from margin compression into neutral pass-through.
In the current 2025-2026 environment, where input cost inflation has moderated but remains above historical averages, pricing discipline separates successful turnarounds from failed ones. Companies that implemented systematic pricing improvements in 2024-2025 are now realizing 200-400 basis points of margin expansion as volume stabilizes.
04 Cost Reduction: Structural vs. Tactical Approaches
Cost reduction remains central to operational restructuring, but execution sophistication separates sustainable turnarounds from short-lived improvements. The critical distinction lies between structural cost reduction (changing the underlying cost structure) and tactical cost reduction (one-time or temporary savings).
Structural Cost Reduction Initiatives
Footprint rationalization: Consolidating facilities, warehouses, or offices to eliminate fixed cost duplication and improve utilization. A recent industrial products turnaround reduced manufacturing footprint from seven facilities to four, eliminating $12.3 million in annual fixed costs while improving overall equipment effectiveness (OEE) from 62% to 78% through better asset utilization.
Organizational redesign: Flattening hierarchies, widening spans of control, and eliminating non-value-adding layers. Best-practice organizations maintain average spans of control of 7-10 direct reports for managers; distressed companies often exhibit spans of 3-5, indicating structural overstaffing. Organizational redesign typically reduces headcount by 15-25% while improving decision velocity.
Process reengineering: Fundamentally redesigning core processes to eliminate waste, handoffs, and non-value-adding activities. Lean manufacturing and Six Sigma methodologies remain highly relevant, though turnaround timelines demand rapid, focused application rather than comprehensive multi-year transformations.
Outsourcing and shared services: Converting fixed costs to variable costs through selective outsourcing, or achieving scale economies through shared services implementation. Finance, HR, and IT functions commonly offer 20-35% cost reduction opportunities through these approaches.
Tactical Cost Reduction Initiatives
While structural changes deliver sustainable improvements, tactical initiatives generate immediate cash flow relief—critical for companies facing liquidity constraints:
- Discretionary spend freeze: Immediate suspension of non-essential spending including travel, consulting, training, and marketing. Typically saves 3-7% of operating expenses within 30 days.
- Hiring freeze: Halting all non-critical hiring, allowing natural attrition to reduce headcount. Generates 1-2% quarterly headcount reduction without severance costs.
- Supplier payment extension: Renegotiating payment terms from net-30 to net-60 or net-90. While technically a working capital improvement rather than cost reduction, the cash flow impact is immediate and substantial.
- Contract renegotiation: Systematically renegotiating all significant vendor contracts, targeting 10-20% reductions. The current environment, with many suppliers facing their own demand challenges, has created unusual negotiating leverage for buyers.
The most effective turnarounds sequence tactical and structural initiatives to create a "cash bridge"—tactical actions generate immediate liquidity to fund structural changes that deliver sustainable improvements. A recent retail turnaround generated $8.4 million in tactical savings within 45 days, providing the cash required to fund a $14.2 million facility consolidation that ultimately delivered $19.7 million in annual structural savings.
05 Working Capital Optimization: The Cash Conversion Imperative
Working capital optimization deserves special emphasis in operational restructuring because it simultaneously improves cash flow and EBITDA (through reduced financing costs and improved asset efficiency). Turnaround professionals target three primary components:
Inventory Reduction
Distressed companies typically carry 25-40% excess inventory relative to optimized levels, representing both cash tied up and ongoing carrying costs (storage, insurance, obsolescence, financing). Systematic inventory reduction follows a structured approach:
- SKU rationalization: Eliminating slow-moving and obsolete items, typically representing 20-30% of total SKUs but less than 5% of revenue
- Safety stock optimization: Recalculating safety stock levels based on actual demand variability and lead times rather than historical rules-of-thumb
- Lot size optimization: Balancing setup costs against carrying costs using economic order quantity (EOQ) or similar methodologies
- Consignment and vendor-managed inventory: Shifting inventory ownership to suppliers where economically advantageous
A distribution company recently reduced inventory from $47.3 million to $32.8 million (31% reduction) while maintaining 98.5% fill rates—releasing $14.5 million in cash and reducing annual carrying costs by $2.2 million.
Receivables Acceleration
Days sales outstanding (DSO) in distressed companies often exceeds industry benchmarks by 15-25 days, indicating collection process breakdowns or customer credit quality deterioration. Improvement initiatives include:
- Credit policy tightening and rigorous enforcement
- Collection process redesign with clear escalation protocols
- Early payment discount programs (when economically justified)
- Customer payment term renegotiation
- Selective use of factoring for high-risk accounts
Payables Extension
While extending payables improves cash flow, turnaround professionals must balance short-term liquidity needs against supplier relationship preservation. Sophisticated approaches include:
- Tiered payment strategies based on supplier criticality and leverage
- Supply chain financing programs that benefit both parties
- Volume commitment exchanges for extended terms
- Transparent communication to maintain trust during difficult periods
Collectively, working capital optimization in successful turnarounds releases cash equal to 8-15% of annual revenue—often the difference between survival and insolvency during the critical early months.
06 Implementation Velocity: The 100-Day Plan
Turnaround success correlates strongly with implementation velocity. Stakeholders—lenders, investors, employees, customers—need to see tangible progress quickly to maintain confidence. The "100-day plan" has become the standard framework for structuring initial turnaround efforts.
A properly constructed 100-day plan includes:
Days 1-30: Assessment and Stabilization
- Complete diagnostic assessment of financial position, operational performance, and organizational capability
- Implement immediate cash preservation measures (discretionary spend freeze, hiring freeze, payment prioritization)
- Establish weekly cash flow forecasting and monitoring
- Communicate transparently with key stakeholders
- Secure necessary short-term liquidity (additional borrowing capacity, payment term extensions)
Days 31-60: Planning and Quick Wins
- Develop comprehensive EBITDA bridge with initiative-level detail
- Assign ownership and accountability for each initiative
- Implement quick-win initiatives that generate visible results (contract renegotiations, discretionary spend elimination, pricing actions)
- Begin structural initiatives with longer implementation timelines (footprint rationalization, organizational redesign)
- Establish performance management cadence (weekly leadership reviews, monthly board updates)
Days 61-100: Execution and Momentum
- Drive execution of planned initiatives with rigorous tracking against milestones
- Course-correct based on early results and changing circumstances
- Communicate progress internally and externally to build confidence
- Begin planning for post-stabilization growth and value creation
- Assess organizational capability gaps and begin talent upgrades where necessary
In a recent industrial services turnaround, the 100-day plan delivered $6.8 million in annualized EBITDA improvement (42% of the total $16.2 million target) and released $11.3 million in working capital—creating the credibility and cash flow required to execute the longer-term transformation.
07 Organizational and Cultural Dimensions
Technical excellence in financial analysis and operational improvement is necessary but insufficient for turnaround success. The organizational and cultural dimensions often determine whether well-designed plans translate into actual results.
Leadership and Talent
Turnaround situations frequently require leadership changes. Research indicates that 60-75% of successful turnarounds involve CEO replacement within the first six months. Beyond the CEO, turnaround professionals systematically assess the entire leadership team against the capabilities required for the new operating model, typically resulting in 30-50% turnover in the top two organizational layers.
The current talent market of 2025-2026 presents both challenges and opportunities. While competition for proven turnaround executives remains intense, the broader economic uncertainty has increased the availability of experienced operators willing to take on challenging situations.
Communication and Transparency
Effective turnaround leaders communicate with unusual transparency and frequency. Employees, customers, suppliers, and lenders all need to understand the situation, the plan, and their role in the solution. Weekly all-hands meetings, detailed initiative tracking visible throughout the organization, and honest acknowledgment of setbacks build the trust required for sustained effort.
Performance Management and Accountability
Turnarounds demand performance management intensity that exceeds normal operating environments. Best practices include:
- Weekly initiative reviews with clear red/yellow/green status indicators
- Individual accountability for specific financial targets
- Rapid consequences for non-performance (reassignment or exit within 30-60 days rather than extended performance improvement plans)
- Incentive compensation tied directly to turnaround milestones and financial targets
08 Measuring Success: Key Performance Indicators
Turnaround professionals track a comprehensive set of KPIs that extend beyond traditional financial metrics:
Financial Metrics:
- EBITDA and EBITDA margin (weekly flash estimates, monthly actuals)
- Revenue and gross margin by product/customer/geography
- Cash flow and liquidity (daily cash position, 13-week cash flow forecast)
- Working capital components (inventory turns, DSO, DPO)
- Covenant compliance and liquidity headroom
Operational Metrics:
- Capacity utilization and asset efficiency (OEE for manufacturing)
- Quality metrics (defect rates, customer complaints, returns)
- Delivery performance (on-time delivery, order fulfillment rates)
- Productivity metrics (revenue per employee, units per labor hour)
Initiative Tracking Metrics:
- Percentage of initiatives on-track vs. at-risk vs. behind
- Actual savings/improvements vs. plan by initiative
- Implementation milestone completion rates
- One-time restructuring costs vs. budget
The most sophisticated turnaround teams maintain real-time dashboards that provide daily visibility into these metrics, enabling rapid response to emerging issues.
09 Case Study: Multi-Dimensional Value Creation
A mid-market industrial manufacturer with $340 million in revenue and negative $8.2 million EBITDA provides an illustrative example of comprehensive operational restructuring. The company faced declining volumes in core markets, an unsustainable cost structure, and deteriorating working capital that had pushed it into covenant violation.
The turnaround team implemented a 100-day plan that addressed all dimensions simultaneously:
Revenue optimization: Customer profitability analysis revealed that 23% of customers were unprofitable after fully-loaded costs. Exiting these relationships over six months reduced revenue by $78 million but improved gross profit by $11.4 million. Simultaneously, pricing discipline improvements added 180 basis points to gross margin on retained business.
Cost reduction: Manufacturing footprint consolidation from five facilities to three eliminated $14.7 million in fixed costs. Organizational redesign reduced headcount from 1,240 to 890 (28% reduction) while improving spans of control and decision-making speed. Procurement initiatives delivered $8.3 million in material cost savings.
Working capital optimization: Inventory reduction from $89 million to $61 million released $28 million in cash. DSO improvement from 67 days to 52 days released an additional $14 million. Combined working capital improvements totaled $42 million.
Process improvement: Lean manufacturing implementation improved OEE from 58% to 74%, enabling the facility consolidation while maintaining capacity. Cycle time reduction improved customer delivery performance from 78% on-time to 94% on-time.
The cumulative impact over 18 months: EBITDA improved from negative $8.2 million to positive $38.6 million (a $46.8 million swing), representing 11.4% EBITDA margin on the new $262 million revenue base. Enterprise value increased from approximately $60 million (distressed valuation) to $270 million (7.0x EBITDA multiple), creating $210 million in stakeholder value.
10 The Role of Technology and Analytics
Modern operational restructuring increasingly leverages advanced analytics and digital tools to accelerate insights and improve decision-making. Turnaround professionals in 2025-2026 routinely deploy:
- Predictive analytics: Machine learning models that identify customer churn risk, demand patterns, and operational bottlenecks
- Real-time dashboards: Cloud-based business intelligence platforms providing daily visibility into operational and financial performance
- Scenario modeling: Sophisticated financial models that quantify the impact of alternative strategic choices and sensitivity to key assumptions
- Process mining: Software that analyzes transaction data to identify process inefficiencies and improvement opportunities
Professional valuation platforms like iValuate have become essential tools for turnaround professionals, enabling rapid scenario analysis and valuation updates as restructuring initiatives progress. The ability to quickly model the enterprise value impact of operational improvements helps prioritize initiatives and communicate progress to stakeholders.
11 Looking Forward: Operational Restructuring in 2026 and Beyond
As we progress through 2025 and into 2026, several trends are reshaping operational restructuring:
Supply chain resilience over pure efficiency: The supply chain disruptions of 2020-2024 have permanently shifted the optimization calculus. Companies are building redundancy and flexibility into supply chains, accepting modestly higher costs in exchange for reduced risk. Turnaround professionals must balance cost reduction imperatives against resilience requirements.
Sustainability and ESG integration: Operational restructuring increasingly incorporates environmental and social considerations, both because stakeholders demand it and because energy efficiency and waste reduction often align with cost reduction. Carbon footprint reduction and circular economy principles are becoming standard elements of operational improvement initiatives.
Technology-enabled transformation: Digital tools that were "nice to have" in previous cycles are now essential. Turnarounds increasingly include investments in ERP systems, automation, and data analytics—even in distressed situations where capital is constrained. The ROI on these investments, when properly scoped and implemented, typically exceeds 300% within 24 months.
Talent and organizational agility: The shift to hybrid work, changing employee expectations, and skills shortages in critical areas (data analytics, digital marketing, advanced manufacturing) require new approaches to organizational design and talent management. Successful turnarounds are building more flexible, skills-based organizations rather than traditional hierarchical structures.
The fundamental principles of operational restructuring—rigorous analysis, disciplined execution, comprehensive EBITDA bridge management, and relentless focus on cash flow—remain constant. However, the specific initiatives, tools, and organizational approaches continue to evolve with changing market conditions and stakeholder expectations.
For CFOs, M&A advisors, and private equity professionals navigating distressed situations in 2025-2026, operational restructuring represents the most reliable path to value creation. While financial engineering and balance sheet restructuring remain important tools, sustainable turnarounds are built on fundamental operational improvements that enhance competitive position and cash generation capability. The turnaround professionals who master the frameworks, analytics, and execution disciplines outlined in this article will continue to create substantial value for stakeholders—transforming distressed situations into profitable, growing enterprises. Modern platforms like iValuate support these professionals by providing the analytical infrastructure required to model, track, and communicate the value creation journey from distress to recovery.