Table of Contents10 sections
In the current economic environment of 2025-2026, characterized by elevated interest rates, compressed margins, and heightened scrutiny from lenders and investors, operational restructuring has emerged as the primary value creation lever for distressed companies. Unlike financial engineering or balance sheet recapitalizations, operational turnarounds focus on fundamentally improving the business's ability to generate cash flow through systematic improvements in cost structure, operational efficiency, and strategic positioning.
The stakes have never been higher. According to recent data from the American Bankruptcy Institute, corporate restructuring activity has increased 34% year-over-year, with operational underperformance cited as the primary driver in 68% of cases. For turnaround professionals, private equity sponsors, and corporate boards, the ability to execute rapid, sustainable operational improvements often determines whether a company emerges stronger or liquidates assets at distressed valuations.
01 The Operational Restructuring Framework
Operational restructuring differs fundamentally from financial restructuring in both approach and outcome. While financial restructuring addresses the right side of the balance sheet—renegotiating debt terms, converting obligations to equity, or securing new capital—operational restructuring targets the income statement and cash flow generation capacity. The most successful turnarounds employ both strategies in parallel, but operational improvements typically drive 60-75% of total enterprise value creation in distressed situations.
The core framework employed by leading turnaround professionals follows a systematic approach across five dimensions:
- Cost structure optimization: Identifying and eliminating non-value-adding expenses while protecting revenue-generating capabilities
- Working capital management: Accelerating cash conversion cycles through inventory optimization, receivables management, and strategic payables extension
- Operational efficiency: Improving throughput, reducing waste, and enhancing productivity across core processes
- Revenue stabilization: Protecting and rebuilding the customer base while pruning unprofitable products or segments
- Organizational realignment: Right-sizing the workforce and restructuring reporting lines to match the company's current reality
Each dimension requires different analytical tools, implementation timelines, and change management approaches. The art of turnaround management lies in sequencing these interventions to maximize cash preservation while maintaining operational continuity.
02 The EBITDA Bridge: Quantifying Value Creation
The EBITDA bridge has become the standard analytical tool for tracking and communicating operational restructuring progress. This waterfall analysis decomposes the change in EBITDA from baseline to target state, attributing improvements to specific initiatives and quantifying their individual contributions.
A typical EBITDA bridge in a middle-market operational turnaround might show the following structure:
- Baseline EBITDA: Starting point, often negative or severely depressed (e.g., -$2.5M or 2% margin)
- Revenue impact: Effect of volume changes, price adjustments, and mix shifts (typically -5% to +3% in year one)
- Direct cost reductions: Materials optimization, manufacturing efficiency, logistics improvements (+8-15% of revenue)
- Indirect cost reductions: SG&A rationalization, facility consolidation, overhead reduction (+5-12% of revenue)
- Working capital benefits: Cash flow improvements that reduce financing costs (+1-3% of revenue)
- One-time costs: Restructuring charges, severance, facility closures (-3-8% of revenue, typically)
- Target EBITDA: Sustainable run-rate after restructuring (typically 12-18% margin for manufacturing, 15-25% for services)
In a recent engagement with a $150M revenue industrial distributor, our team constructed an EBITDA bridge that identified $18.2M in potential improvements over 18 months. The baseline EBITDA of $3.8M (2.5% margin) was projected to reach $22.0M (14.7% margin) through: $4.2M in procurement savings, $5.8M in logistics and warehousing optimization, $3.9M in SG&A reduction, $2.1M in pricing and mix improvements, and $2.4M in working capital-related savings. After accounting for $3.5M in one-time restructuring costs, the net improvement exceeded 480% of baseline EBITDA.
The EBITDA bridge serves not only as an analytical tool but as a communication framework for stakeholders. Lenders want to see the path to debt service coverage, equity sponsors need to understand value creation potential, and management teams require clear targets for accountability.
03 Cost Reduction: Beyond Simple Headcount Cuts
The most common misconception about operational restructuring is that it primarily involves workforce reductions. While labor costs typically represent 25-45% of total operating expenses in most industries, sustainable turnarounds require a more sophisticated approach to cost reduction that preserves organizational capability while eliminating waste.
Direct Cost Optimization
Direct costs—materials, labor, and overhead directly attributable to production or service delivery—offer substantial improvement opportunities that don't compromise revenue generation. Leading turnaround professionals employ several proven techniques:
Strategic sourcing and procurement redesign: Most distressed companies have neglected supplier management during their decline. A comprehensive spend analysis typically reveals 15-30% of procurement occurring off-contract, multiple suppliers for identical items, and outdated pricing agreements. In a 2025 turnaround of a specialty chemicals manufacturer, consolidating the supplier base from 847 to 312 vendors and renegotiating contracts generated $6.8M in annual savings on a $94M cost base—a 7.2% reduction without changing specifications or quality standards.
Manufacturing and operations efficiency: Process optimization through lean manufacturing principles, capacity utilization improvements, and quality enhancement programs typically yield 10-20% productivity gains. These improvements require minimal capital investment but demand disciplined execution. Time-and-motion studies, value stream mapping, and statistical process control identify bottlenecks and waste that accumulated during years of underinvestment.
Logistics and supply chain rationalization: Distribution networks often reflect historical growth patterns rather than current optimal configurations. Warehouse consolidation, transportation route optimization, and inventory positioning can reduce logistics costs by 12-25% while improving service levels. One consumer products company reduced its distribution center footprint from 14 to 8 facilities, cutting annual logistics costs from $23.4M to $18.1M while reducing average delivery times by 1.3 days.
Indirect Cost Reduction
Selling, general, and administrative expenses frequently balloon during periods of growth and remain stubbornly high during decline. SG&A as a percentage of revenue in distressed companies often runs 300-500 basis points above industry benchmarks. Systematic SG&A reduction follows a zero-based budgeting approach:
- Functional benchmarking: Compare each department's cost structure to industry standards and best-in-class performers
- Activity-based analysis: Identify which activities truly support revenue generation or regulatory compliance versus legacy processes
- Span of control optimization: Restructure reporting relationships to reduce management layers and increase manager-to-staff ratios from typical distressed company levels of 1:4-5 to healthy norms of 1:8-12
- Discretionary spend elimination: Suspend or dramatically reduce travel, consulting, marketing, and other controllable expenses until cash flow stabilizes
A professional services firm we advised reduced SG&A from 42% of revenue to 28% over 14 months through systematic application of these principles, generating $11.2M in annual savings while actually improving client satisfaction scores by 8 points.
04 Working Capital: The Hidden Value Driver
Working capital optimization represents one of the most overlooked value creation opportunities in operational restructuring. While not directly reflected in EBITDA, improvements in the cash conversion cycle generate immediate liquidity and reduce financing costs—critical factors when companies are operating under tight credit constraints or ABL facilities with restrictive borrowing bases.
The cash conversion cycle (CCC) measures the number of days between cash outflow for inputs and cash collection from customers. The formula is straightforward: Days Inventory Outstanding + Days Sales Outstanding - Days Payables Outstanding = Cash Conversion Cycle. In distressed situations, the CCC often extends to 60-90+ days in industries where healthy companies operate at 30-45 days.
Inventory Optimization
Excess inventory ties up cash, incurs carrying costs (typically 20-35% annually including financing, storage, insurance, and obsolescence), and often masks operational inefficiencies. Turnaround professionals employ several levers:
- SKU rationalization: Eliminate slow-moving items, consolidate similar products, and focus inventory investment on high-velocity items. A typical analysis reveals that 60-70% of SKUs generate less than 20% of revenue.
- Safety stock recalibration: Recalculate reorder points and safety stock levels based on current demand patterns rather than historical assumptions from growth periods
- Consignment and vendor-managed inventory: Shift inventory ownership to suppliers where possible, converting balance sheet assets to just-in-time availability
In a recent manufacturing turnaround, reducing inventory from $42M to $28M (from 127 days to 84 days) generated $14M in immediate cash while reducing annual carrying costs by $3.1M—a permanent EBITDA improvement equivalent to 2.1% of revenue.
Receivables Management
Days Sales Outstanding (DSO) frequently deteriorates in distressed companies as sales teams offer extended terms to maintain volume and collection efforts weaken due to understaffing or poor systems. Aggressive but professional collection practices can reduce DSO by 10-20 days, generating significant cash release:
- Implement systematic collection calling schedules with escalation protocols
- Offer early payment discounts (1-2% for payment within 10 days) that are economically attractive given the company's cost of capital
- Place slow-paying accounts on credit hold and require cash-in-advance for repeat offenders
- Consider factoring or receivables financing for immediate liquidity, despite the cost
Payables Extension
While extending Days Payables Outstanding must be managed carefully to avoid supplier disruptions, strategic payables management can fund working capital improvements. Negotiating extended terms with financially stable suppliers, taking advantage of payment terms already offered but not utilized, and prioritizing payments to critical suppliers while extending others can add 5-15 days to DPO without damaging relationships.
A comprehensive working capital program in a $200M revenue distribution company reduced the cash conversion cycle from 68 days to 41 days, releasing $14.8M in cash—equivalent to 7.4% of annual revenue and sufficient to fully repay the company's revolver and restore borrowing capacity.
05 Revenue Stabilization and Strategic Focus
While operational restructuring emphasizes cost reduction, protecting and stabilizing revenue streams is equally critical. The most successful turnarounds don't simply cut their way to profitability—they strategically refocus the business on profitable customer segments and product lines while pruning value-destroying activities.
Customer and Product Profitability Analysis
Distressed companies often lack accurate customer and product-level profitability data. Implementing activity-based costing reveals that typically 20-30% of customers and 30-40% of products destroy value when fully loaded costs are allocated. A rigorous profitability analysis enables several strategic actions:
- Customer pruning: Exit relationships with chronically unprofitable customers, particularly those requiring high service levels, demanding extended payment terms, or generating frequent returns and complaints
- Product line rationalization: Discontinue low-margin, low-volume products that consume disproportionate resources in production planning, inventory management, and sales support
- Pricing discipline: Implement price increases on products and customers with inelastic demand, even if modest volume losses occur
- Resource reallocation: Redirect sales and marketing resources toward high-margin opportunities
In a 2024-2025 turnaround of a specialty food manufacturer, customer profitability analysis revealed that 87 of 340 customers (26%) generated negative gross margins after accounting for slotting fees, promotional allowances, and dedicated production runs. Exiting these relationships reduced revenue by $18M (12%) but improved gross profit by $4.2M and freed up production capacity for more profitable products. The resulting revenue of $132M at 34% gross margin significantly outperformed the previous $150M at 28% margin.
Sales Force Effectiveness
Sales productivity often declines precipitously in distressed situations as top performers depart and remaining team members become demoralized. Restructuring the sales organization involves:
- Right-sizing the team based on realistic revenue projections and productivity benchmarks
- Implementing activity-based metrics and accountability systems
- Revising compensation plans to emphasize margin over volume
- Providing tools and training to improve conversion rates and average transaction values
06 Implementation Velocity and Change Management
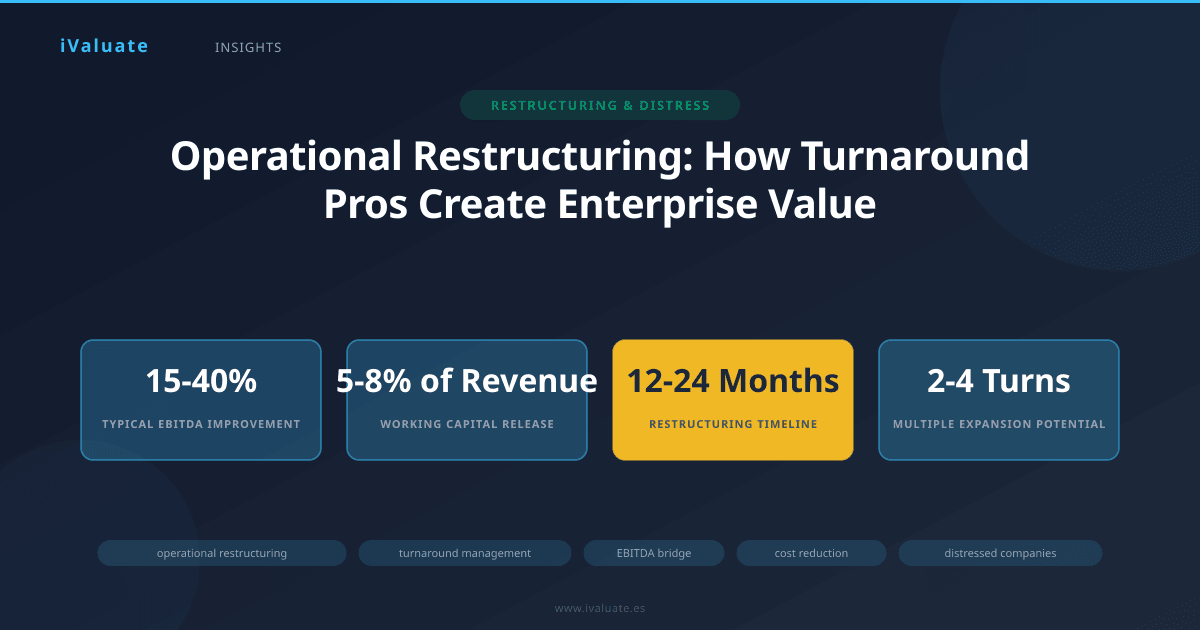
The timeline for operational restructuring typically spans 12-24 months, but the sequence and velocity of implementation critically impact outcomes. Turnaround professionals generally follow a "quick wins, then sustainable improvements" approach:
Days 1-30 (Stabilization): Implement immediate cash preservation measures including discretionary spend freezes, hiring freezes, capital expenditure suspension, and aggressive working capital management. These actions typically generate 15-25% of total value creation but are essential for survival.
Months 2-6 (Quick Wins): Execute high-impact, low-complexity initiatives including vendor renegotiations, headcount reductions, facility consolidations, and customer/product pruning. These initiatives deliver 40-50% of total value creation and build credibility with stakeholders.
Months 7-18 (Sustainable Improvements): Implement process redesign, system enhancements, organizational restructuring, and capability building that generate the remaining 25-35% of value creation and ensure sustainability.
Months 19-24 (Stabilization and Exit): Transition from turnaround management to steady-state operations, document new processes, and prepare for management transition or sale.
Change management represents the most significant implementation challenge. Employees in distressed companies are typically exhausted, skeptical, and resistant to further disruption. Successful turnaround leaders employ several critical practices:
- Transparent communication: Share the business reality candidly, explain the rationale for changes, and provide regular progress updates
- Quick wins visibility: Publicize early successes to build momentum and credibility
- Selective retention: Identify and protect high performers while decisively exiting poor performers and resisters
- Accountability systems: Implement rigorous tracking of initiative progress with weekly reviews and clear ownership
07 Measuring Success: Value Creation Metrics
Operational restructuring success is ultimately measured by enterprise value creation, but intermediate metrics provide essential tracking and accountability. Leading turnaround professionals monitor a comprehensive dashboard:
Financial metrics:
- EBITDA margin expansion (target: 800-1200 basis points improvement)
- Cash flow generation (target: positive operating cash flow within 6-9 months)
- Revenue retention (target: limit decline to <15% during restructuring)
- Working capital as % of revenue (target: reduction of 300-500 basis points)
Operational metrics:
- Productivity measures (revenue per employee, units per labor hour)
- Quality indicators (defect rates, customer complaints, on-time delivery)
- Cycle time reductions (order-to-cash, quote-to-order, manufacturing lead times)
Strategic metrics:
- Customer retention rate (target: >85% of profitable customers)
- Employee engagement scores (critical for sustainability)
- Market share in core segments (target: stabilization or growth)
The ultimate validation comes from valuation multiples. A successful operational restructuring typically expands enterprise value multiples by 2-4 turns of EBITDA. A company entering restructuring at 3.5x EBITDA on a depressed earnings base might exit at 6.5-7.5x on normalized, sustainable EBITDA—representing total enterprise value creation of 300-500% when combining multiple expansion and EBITDA growth.
08 Case Study: Industrial Services Turnaround
A representative example illustrates the comprehensive value creation potential. In early 2024, a $280M revenue industrial services company entered restructuring with EBITDA of $8.4M (3.0% margin), negative cash flow of $12M annually, and a stressed balance sheet with $85M in debt trading at 65 cents on the dollar.
The operational restructuring program implemented over 18 months included:
- Workforce reduction from 2,100 to 1,650 employees, generating $18.2M in annual savings
- Facility consolidation from 47 to 32 locations, saving $6.8M annually
- Procurement optimization across $94M in vendor spend, yielding $8.1M in savings
- Customer pruning (exiting 140 unprofitable relationships), reducing revenue by $31M but improving gross margin by 420 basis points
- Working capital reduction from $67M to $42M (from 87 to 61 days), releasing $25M in cash
- SG&A reduction from 24% to 17% of revenue through process automation and organizational restructuring
The results after 18 months: Revenue of $249M (down 11% but strategically refocused), EBITDA of $34.7M (13.9% margin), and positive operating cash flow of $28M. Enterprise value increased from approximately $120M (implied by debt trading levels) to $260M (7.5x normalized EBITDA), representing 117% value creation. The company successfully refinanced its debt, repaid $32M in principal, and positioned itself for either continued independent operation or a strategic sale at normalized multiples.
09 The Role of Technology and Analytics
Modern operational restructuring increasingly relies on sophisticated analytics and technology platforms. The availability of real-time data, advanced analytics, and purpose-built software has dramatically improved both the speed and precision of turnaround initiatives.
Leading practices include:
- Predictive analytics: Machine learning models identify customer churn risk, predict product demand patterns, and optimize inventory levels with greater accuracy than traditional methods
- Process mining: Automated analysis of transaction data reveals actual process flows, bottlenecks, and inefficiencies that may not be apparent in documented procedures
- Scenario modeling: Sophisticated financial models test multiple restructuring scenarios, quantifying risks and returns for different initiative combinations
- Performance dashboards: Real-time tracking of key metrics enables rapid course correction and maintains stakeholder confidence
Professional valuation and analysis platforms have become essential tools in the restructuring toolkit. Solutions like iValuate enable turnaround professionals to rapidly model different operational scenarios, track value creation against benchmarks, and communicate progress to stakeholders through standardized reporting frameworks. The ability to quickly quantify the enterprise value impact of specific operational initiatives—whether a facility closure, customer pruning decision, or working capital program—has become table stakes in modern restructuring practice.
10 Looking Forward: Operational Restructuring in 2025-2026
The operational restructuring landscape continues to evolve as economic conditions, stakeholder expectations, and available tools change. Several trends are shaping the practice in 2025-2026:
Increased focus on sustainability: Stakeholders increasingly demand that restructured companies emerge not just financially healthy but operationally sustainable and environmentally responsible. Energy efficiency, waste reduction, and supply chain resilience have become integral to restructuring programs rather than afterthoughts.
Technology-enabled transformation: The declining cost and increasing accessibility of automation, artificial intelligence, and cloud-based systems enable distressed companies to leapfrog competitors through technology adoption during restructuring. What was once viewed as a luxury investment is now recognized as essential for competitiveness.
Compressed timelines: Stakeholder patience has diminished, and the window for operational improvement has narrowed. Restructuring programs that once spanned 24-36 months are now expected to deliver results in 12-18 months, requiring more aggressive action and greater implementation risk.
Hybrid approaches: The distinction between operational and financial restructuring has blurred, with most successful turnarounds employing integrated strategies that address both operational performance and capital structure simultaneously.
For turnaround professionals, private equity sponsors, and corporate boards, operational restructuring remains the most reliable path to value creation in distressed situations. While financial engineering can provide temporary relief, sustainable value emerges from fundamental improvements in the business's ability to generate cash flow through superior operations, disciplined cost management, and strategic focus.
The companies that emerge strongest from restructuring share common characteristics: decisive leadership, rigorous analytics, disciplined execution, and unwavering focus on cash generation. They leverage modern tools and platforms—including specialized solutions like iValuate—to accelerate analysis, improve decision quality, and track progress against clearly defined value creation targets. In an environment where operational excellence increasingly separates winners from losers, the ability to execute comprehensive operational restructuring has never been more valuable.