Table of Contents9 sections
The discounted cash flow model remains the cornerstone of intrinsic valuation, but its application to high-growth companies presents unique challenges that demand sophisticated multi-stage frameworks. As we navigate the 2025-2026 market environment—characterized by elevated interest rates, selective venture funding, and increased scrutiny of growth-at-any-cost business models—the ability to properly structure and calibrate multi-stage DCF models has become essential for credible valuation work.
Single-stage perpetuity models, while elegant in their simplicity, fail catastrophically when applied to companies experiencing supernormal growth. A SaaS company growing revenue at 60% annually cannot maintain that trajectory indefinitely; competitive dynamics, market saturation, and the mathematical impossibility of exceeding total addressable market size ensure eventual deceleration. Multi-stage models explicitly recognize this reality by segmenting the forecast period into distinct phases with different growth characteristics.
01 The Fundamental Problem: Growth Cannot Persist Indefinitely
The mathematical constraint is straightforward: if a company grows faster than the overall economy in perpetuity, it will eventually represent more than 100% of GDP—an obvious impossibility. Yet many analysts struggle to determine precisely when and how growth should decelerate. This challenge has intensified in recent years as technology-enabled businesses have demonstrated the ability to scale more rapidly and sustain elevated growth rates longer than historical precedents suggested possible.
Consider the cohort of cloud infrastructure companies that went public between 2019 and 2021. At IPO, these businesses typically exhibited revenue growth rates of 40-80% annually. By 2025, even the most successful among them have seen growth moderate to 20-35% ranges as they've scaled past $1-2 billion in annual recurring revenue. This deceleration wasn't a failure of execution—it was the inevitable physics of scaling within finite markets.
The critical insight: growth fade is not a pessimistic assumption but a mathematical necessity. The question is not whether growth will moderate, but when and at what rate.
02 When to Deploy Multi-Stage Models
The decision to use a two-stage versus three-stage model should be driven by the company's specific growth trajectory and competitive position, not by convention or template selection. Here's the technical framework:
Two-Stage Models: Appropriate Applications
A two-stage model divides the forecast into a high-growth period followed by stable perpetual growth. This structure works well when:
- Clear inflection point exists: The company faces an identifiable catalyst that will trigger growth deceleration (e.g., patent expiration, market saturation, regulatory change)
- Mature growth profile: Current growth rates are already moderating toward sustainable levels (typically sub-30% annual growth)
- Limited visibility: Competitive dynamics or market uncertainty make granular long-term forecasting unreliable
- Simplified communication needs: Stakeholders require straightforward valuation logic without excessive complexity
In practice, two-stage models are most commonly applied to later-stage private companies preparing for exit, public companies with established market positions, and businesses in relatively stable industries experiencing modest disruption.
Three-Stage Models: When Complexity Adds Value
Three-stage models introduce an intermediate transition period between high growth and steady state. This additional stage is warranted when:
- Extended high-growth runway: The company is early in its lifecycle with 5+ years of supernormal growth ahead (common in venture-backed technology companies)
- Gradual market maturation: The addressable market itself is expanding, allowing the company to maintain elevated growth even as market share stabilizes
- Multi-product evolution: Sequential product launches or market expansions create waves of growth rather than a single deceleration curve
- Regulatory or technological transitions: External factors will drive gradual rather than abrupt changes in growth dynamics
A practical example: In 2025, when valuing a Series C cybersecurity company with 70% annual growth, a three-stage model is typically appropriate. Stage 1 (years 1-4) might project 65-40% growth as the company scales its core product. Stage 2 (years 5-8) would model 35-15% growth as market penetration deepens and new product lines contribute. Stage 3 represents perpetual steady-state growth of 3-4%, aligned with nominal GDP growth.
03 Calibrating Growth Fade: The Technical Framework
The transition from high growth to steady state represents the most consequential assumption in multi-stage DCF models, yet it's often handled with insufficient rigor. Growth fade calibration requires both theoretical grounding and empirical validation.
The Convergence Principle
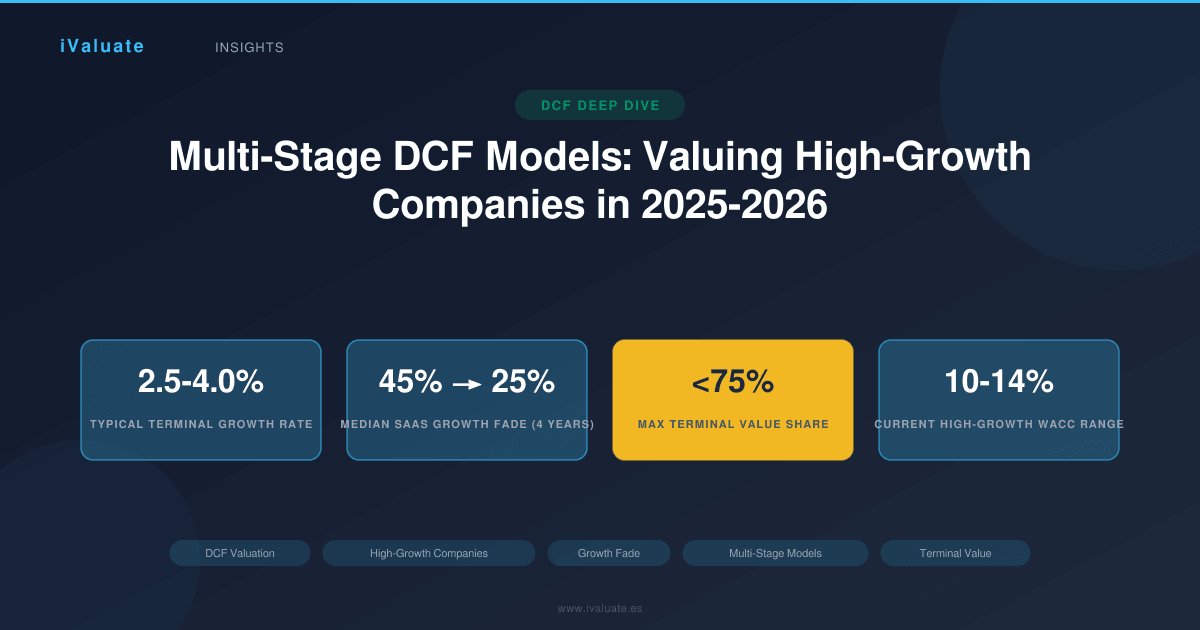
Terminal growth rates must converge to sustainable long-term economic growth. In the current environment, this typically means 2.5-4.0% for developed markets, reflecting expected nominal GDP growth. Using terminal growth rates above 4% implies the company will eventually dominate the entire economy—a logical impossibility that signals model misspecification.
However, the path to convergence varies dramatically by company characteristics. Research analyzing 500+ technology IPOs from 2010-2023 reveals distinct fade patterns:
- Winner-take-most platforms: Maintain 25-35% growth for 6-8 years before rapid deceleration to sub-15% growth (examples: dominant cloud platforms, network-effect businesses)
- Best-in-category products: Experience more linear fade, declining 5-8 percentage points annually from peak growth rates (examples: vertical SaaS, specialized infrastructure)
- Competitive markets: Show accelerated early fade as competition intensifies, often dropping from 50%+ growth to sub-30% within 3-4 years (examples: consumer applications, crowded enterprise categories)
Mathematical Approaches to Growth Fade
Several quantitative methods can structure the transition period:
Linear fade: Growth rate declines by a constant absolute amount each period. If a company grows at 40% in year 1 and must reach 3% terminal growth by year 10, linear fade would reduce growth by approximately 4.1 percentage points annually. This approach is simple but often unrealistic—growth deceleration typically accelerates as companies mature.
Exponential decay: Growth rate declines by a constant percentage each period. This creates a more realistic convex fade pattern where deceleration is steepest early and gradually moderates. The formula: g(t) = g(terminal) + (g(initial) - g(terminal)) × e^(-λt), where λ is the decay constant calibrated to the transition period length.
S-curve transition: Growth follows a logistic function, maintaining elevated rates longer before accelerating deceleration. This pattern often best reflects reality for platform businesses that achieve strong network effects before facing market saturation. The mathematical form: g(t) = g(terminal) + (g(initial) - g(terminal)) / (1 + e^(k(t-t₀))), where k controls the steepness of the transition and t₀ represents the inflection point.
In 2025-2026 valuations, exponential decay and S-curve approaches have gained favor over linear fade, as they better capture observed deceleration patterns in scaled technology companies.
Empirical Calibration: Learning from Comparable Companies
Theoretical models must be validated against market evidence. The most rigorous approach involves analyzing historical growth trajectories of comparable companies that have already traversed the high-growth-to-maturity transition.
For a high-growth fintech company, this might involve studying the revenue progression of companies like Square (now Block), PayPal, and Adyen from their IPO through current periods. The analysis would document:
- Peak growth rates and the revenue scale at which they occurred
- Number of years to decelerate from peak to sub-20% growth
- Relationship between growth rates and revenue scale (often inverse)
- Impact of new product launches or market expansions on growth trajectory
- Competitive dynamics and market share evolution during the transition
A 2024 analysis of enterprise SaaS companies that IPO'd between 2018-2020 reveals instructive patterns. The median company entered public markets at $200-300 million in ARR growing 45-55% annually. Within four years, median growth had moderated to 22-28%, with the deceleration following an exponential decay pattern (decay constant λ ≈ 0.25). Companies that maintained growth above 35% for 5+ years post-IPO were exclusively those that successfully launched significant new product lines or expanded into adjacent markets.
04 Stage Length Determination: Balancing Precision and Uncertainty
The duration of each stage materially impacts valuation outcomes. Longer high-growth periods increase enterprise value, sometimes dramatically. This creates pressure—conscious or unconscious—to extend optimistic assumptions. Disciplined stage length determination requires:
Market Size Constraints
The company cannot grow faster than its addressable market indefinitely. If a company targets a $10 billion TAM and currently has $500 million in revenue (5% market share), sustaining 50% annual growth for 7 years would require capturing 95% market share—implausible in competitive markets. This mathematical constraint should bound the high-growth period.
Sophisticated analysts layer in TAM expansion assumptions, recognizing that successful companies often expand their addressable markets through product innovation or category creation. However, these TAM expansion assumptions must themselves be credible and supported by evidence of customer willingness to adopt new solutions.
Competitive Dynamics
High returns attract competition. The period during which a company can sustain supernormal growth is inversely related to market contestability. In markets with low barriers to entry, abundant capital, and minimal network effects, high-growth periods rarely exceed 4-5 years. Conversely, businesses with strong moats—proprietary technology, regulatory advantages, powerful network effects—may sustain elevated growth for 7-10 years.
The 2025-2026 environment has seen increased competition in many technology categories as the venture capital correction of 2022-2023 has resolved and funding has returned to attractive markets. This suggests more conservative high-growth period assumptions than might have been appropriate in the 2020-2021 period of capital abundance and limited competitive intensity.
Management Track Record and Execution Risk
Longer forecast periods should be reserved for management teams with demonstrated ability to execute at scale. A founding team taking a company from $50 million to $500 million in revenue has proven different capabilities than scaling from $500 million to $5 billion. The latter requires different organizational structures, go-to-market motions, and operational disciplines.
In practice, this often means limiting the high-growth stage to 3-5 years for earlier-stage companies (Series A-B) and potentially extending to 6-8 years for later-stage businesses (Series D+, pre-IPO) with proven execution capabilities and clear paths to market leadership.
05 Real-World Application: Three Illustrative Cases
Case 1: Enterprise AI Infrastructure Company (Three-Stage Model)
A Series D company providing AI model training infrastructure achieved $180 million in ARR in 2024, growing 85% year-over-year. The valuation required a three-stage approach:
Stage 1 (2025-2028): High growth period with revenue expansion from $300M to $1.2B. Growth rates: 67%, 55%, 45%, 38%. The deceleration reflects increasing scale and emerging competition, but sustained elevation due to strong product-market fit and expanding enterprise AI adoption.
Stage 2 (2029-2033): Transition period with growth moderating from 32% to 18% as the company approaches $3B in revenue. The fade follows an exponential decay pattern (λ = 0.18) calibrated to comparable infrastructure companies like Snowflake and Databricks. New product lines in AI governance and observability provide some growth support.
Stage 3 (2034+): Steady state at 3.5% perpetual growth, slightly above nominal GDP to reflect the company's established position in a structurally growing market segment.
The resulting enterprise value of $8.2 billion (approximately 6.8x forward revenue) reflected both the company's exceptional growth profile and the significant execution risk inherent in the long forecast period.
Case 2: Vertical SaaS Platform (Two-Stage Model)
A profitable vertical SaaS company serving the construction industry generated $420 million in revenue in 2024, growing 28% annually. Market leadership in a defined niche and limited TAM expansion opportunities suggested a two-stage model:
Stage 1 (2025-2029): Growth moderating linearly from 25% to 12% as the company penetrates its addressable market (estimated at $2.5B). The linear fade assumption was appropriate given the relatively predictable market saturation dynamics.
Stage 2 (2030+): Perpetual growth of 3.0%, aligned with construction industry growth expectations and nominal GDP.
The five-year explicit forecast period was shorter than typical for high-growth technology companies, reflecting the company's maturity, market position, and limited runway for sustained supernormal growth. The valuation of $3.1 billion (7.4x revenue) primarily reflected strong profitability and cash generation rather than growth expectations.
Case 3: Consumer Subscription Platform (Three-Stage with Accelerated Fade)
A consumer fitness subscription platform reached $650 million in revenue in 2024, growing 42% annually but facing intensifying competition and customer acquisition cost pressures. The valuation employed a three-stage model with accelerated fade:
Stage 1 (2025-2027): Rapid deceleration from 35% to 22% growth as competition intensifies and the company exhausts its most accessible customer segments. The three-year period reflected limited visibility in a rapidly evolving competitive landscape.
Stage 2 (2028-2031): Continued moderation from 18% to 8% as the company transitions from growth-focused to profitability-focused operations, a common pattern in maturing consumer subscription businesses.
Stage 3 (2032+): Steady state at 2.5%, below nominal GDP growth to reflect the inherently competitive and potentially disrupted nature of consumer fitness markets.
The aggressive fade assumptions—driven by competitive analysis and customer cohort data showing declining retention in recent vintages—resulted in a valuation of $2.8 billion (4.3x revenue), significantly below the 8-12x multiples commanded by the company's faster-growing peers.
06 Common Pitfalls and Technical Considerations
Even experienced practitioners make systematic errors in multi-stage DCF construction:
Inconsistent WACC assumptions: The weighted average cost of capital should evolve across stages as the company's risk profile changes. High-growth companies warrant higher discount rates due to execution risk, competitive uncertainty, and financial leverage constraints. As companies mature into steady state, WACC should decline to reflect reduced business risk and improved access to debt financing. A 200-300 basis point reduction from Stage 1 to Stage 3 is typical for technology companies.
Terminal value dominance: If terminal value represents more than 70-75% of total enterprise value, the model is effectively a single-stage perpetuity with window dressing. This suggests either the explicit forecast period is too short, growth assumptions are too conservative during the forecast period, or the terminal growth rate is too aggressive. Each should be examined and recalibrated.
Margin expansion disconnect: Many models assume simultaneous revenue growth deceleration and margin expansion. While this can occur, it requires explicit explanation of the operational drivers. Margin expansion typically results from operating leverage, improved pricing power, or cost optimization—each of which has limits and should be modeled with the same rigor as revenue growth.
Working capital and capex assumptions: High-growth companies often require significant working capital investment and capital expenditures to fund expansion. As growth moderates, these requirements should decline as a percentage of revenue. Models that hold working capital and capex assumptions constant across all stages systematically misstate free cash flow generation.
07 The 2025-2026 Market Context
Current market conditions materially impact appropriate multi-stage model calibration. Several factors deserve particular attention:
Interest rate environment: With risk-free rates stabilized in the 4.0-4.5% range in early 2025, discount rates for high-growth companies typically fall in the 10-14% range, significantly higher than the 8-10% rates common in the 2020-2021 zero-rate environment. This mechanically reduces the present value of distant cash flows, increasing the relative importance of near-term performance and shortening optimal explicit forecast periods.
Growth quality scrutiny: The market has become significantly more discriminating about growth quality, distinguishing between revenue growth driven by sustainable unit economics versus growth funded by unsustainable customer acquisition spending. This argues for more conservative growth assumptions and shorter high-growth periods for companies with unproven business models.
AI-driven disruption: The rapid advancement of artificial intelligence capabilities creates both opportunities and risks for growth assumptions. Companies successfully deploying AI may sustain elevated growth longer than historical precedents suggest, while those vulnerable to AI disruption may face accelerated competitive pressure. These dynamics should inform both growth trajectories and stage lengths.
08 Practical Implementation and Model Governance
Rigorous multi-stage DCF models require disciplined implementation processes:
Document all assumptions with supporting evidence and rationale. Growth fade assumptions should reference comparable company analysis, market size constraints, and competitive dynamics—not arbitrary judgments. This documentation serves both as quality control during model construction and as defensible support during negotiations or disputes.
Perform sensitivity analysis across key drivers: terminal growth rate, WACC, stage lengths, and fade patterns. Understanding which assumptions most significantly impact valuation helps focus diligence efforts and negotiation discussions on the variables that truly matter.
Validate model outputs against market multiples and precedent transactions. If a DCF model produces a valuation dramatically different from what comparable companies trade at or similar businesses have sold for, the model likely contains specification errors or unrealistic assumptions—even if the mathematics are correct.
Update models regularly as new information emerges. A multi-stage DCF is not a static document but a dynamic framework that should evolve as the company's performance, competitive position, and market conditions change.
09 Conclusion: Precision in Growth Fade Drives Valuation Credibility
Multi-stage DCF models represent the most intellectually honest approach to valuing high-growth companies, explicitly acknowledging that supernormal growth must eventually moderate to sustainable levels. The choice between two-stage and three-stage frameworks should be driven by the specific growth trajectory and competitive dynamics of the business being valued, not by template selection or convention.
Rigorous growth fade calibration—grounded in mathematical principles, validated by comparable company evidence, and bounded by market size constraints—separates credible valuations from aspirational projections. In the current environment of elevated interest rates, increased competition, and heightened scrutiny of growth quality, conservative and well-supported fade assumptions have become essential for defensible valuation work.
The technical complexity of multi-stage models should not obscure their fundamental purpose: translating a company's expected cash flow generation into present value with appropriate consideration of risk and time. When constructed with discipline and calibrated with care, these models provide the most robust foundation for investment decisions, transaction negotiations, and capital allocation.
For professionals regularly performing these complex analyses, platforms like iValuate streamline the technical implementation while maintaining the rigor and flexibility required for credible multi-stage modeling. As valuation challenges grow more sophisticated, the combination of deep technical expertise and efficient analytical tools becomes increasingly essential for delivering the precision that today's market demands.