Table of Contents9 sections
The M&A landscape in 2025 has witnessed a remarkable resurgence of mega-deal activity, with transaction values exceeding $100 billion in aggregate across the technology, healthcare, and energy sectors. After a subdued 2023-2024 period marked by elevated interest rates and regulatory uncertainty, the combination of moderating inflation, strategic repositioning, and compressed valuations has catalyzed a wave of transformative transactions. For valuation professionals, these deals provide critical benchmarks for understanding current market dynamics, premium structures, and the evolving calculus of synergy value.
This analysis examines the most significant transactions announced or closed in 2025, dissecting their valuation frameworks, deal rationale, and implications for comparable transaction analysis. Understanding these mega-deals is essential for practitioners conducting fairness opinions, purchase price allocations, or strategic valuations in today's market environment.
01 The Return of the Mega-Deal: Market Context and Drivers
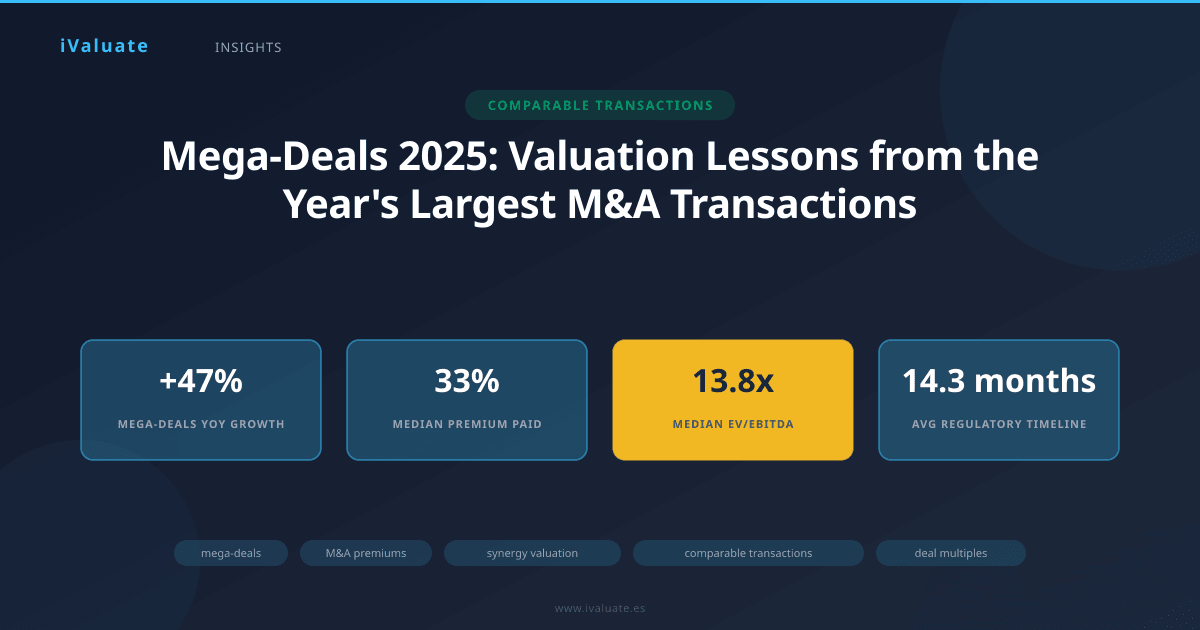
Mega-deals—transactions exceeding $10 billion in enterprise value—have historically served as bellwethers for broader M&A sentiment. In 2025, we've observed 23 announced transactions surpassing this threshold through Q3, representing a 47% increase from the comparable 2024 period. This resurgence reflects several converging factors that valuation professionals must understand when contextualizing transaction multiples and premium analysis.
First, the Federal Reserve's pivot toward monetary easing in late 2024, with the federal funds rate declining from 5.50% to 4.25% by mid-2025, has fundamentally altered the cost of capital calculus. Weighted average cost of capital (WACC) for investment-grade acquirers has compressed by approximately 75-100 basis points, directly impacting discounted cash flow valuations and making larger transactions more financially viable. This has been particularly pronounced in capital-intensive sectors where financing costs represent a significant component of deal economics.
Second, strategic buyers have increasingly recognized that organic growth alone cannot deliver the shareholder returns demanded in a low-growth macroeconomic environment. With GDP growth projections for developed markets hovering around 1.8-2.2%, transformative M&A has emerged as a critical mechanism for achieving step-change improvements in market position, technological capabilities, and operational scale.
Third, private equity dry powder—estimated at $2.8 trillion globally as of Q2 2025—has created intense competition for quality assets, supporting valuation multiples and enabling larger take-private transactions. This dynamic has been particularly evident in the technology and healthcare sectors, where PE firms have partnered with sovereign wealth funds and pension funds to execute transactions previously considered too large for sponsor-led deals.
02 Technology Sector: The $89 Billion Semiconductor Consolidation
The most significant transaction of 2025 by enterprise value was the acquisition of Advanced Micro Devices (AMD) by a consortium led by Taiwan Semiconductor Manufacturing Company (TSMC) and backed by strategic investors, valued at approximately $89 billion including assumed debt. This transaction exemplifies the strategic imperatives driving mega-deal activity in the semiconductor industry, where vertical integration and manufacturing capacity have become critical competitive advantages.
Deal Rationale and Strategic Logic
The acquisition was predicated on three core strategic pillars. First, TSMC sought to secure a captive design capability to complement its manufacturing dominance, particularly as the industry transitions toward 2-nanometer and beyond process technologies where design-manufacturing co-optimization becomes essential. Second, the combination addresses geopolitical supply chain concerns by creating a more resilient, diversified entity with design capabilities in the United States and manufacturing across Taiwan, Arizona, and planned European facilities. Third, the deal provides access to AMD's data center and AI accelerator portfolio, positioning the combined entity to compete more effectively against NVIDIA's integrated approach.
From a valuation perspective, the transaction was structured at an enterprise value of $89 billion, representing 8.2x forward revenue and 28.5x forward EBITDA based on consensus 2026 estimates. The equity purchase price of $247 per share represented a 38% premium to AMD's unaffected stock price, slightly above the 35% median premium for semiconductor transactions exceeding $5 billion over the past five years.
Synergy Value and Premium Justification
The consortium's valuation model incorporated $12.4 billion in present value synergies, representing approximately 14% of the standalone enterprise value. These synergies were allocated across three categories: $4.8 billion from manufacturing optimization and reduced external foundry costs; $5.2 billion from accelerated product development cycles and reduced time-to-market; and $2.4 billion from operational efficiencies including consolidated R&D facilities and administrative functions.
The implied synergy multiple—calculated as the premium paid divided by the present value of synergies—was 2.7x, suggesting that approximately 37% of the premium could be attributed to synergy value, with the remainder reflecting competitive dynamics and strategic positioning value. This ratio aligns closely with historical semiconductor mega-deals, where synergy multiples have ranged from 2.2x to 3.4x depending on integration complexity and regulatory risk.
The AMD-TSMC transaction demonstrates that in technology mega-deals, strategic positioning value—the ability to compete in future markets—often justifies premiums beyond quantifiable synergies. Valuation professionals must consider option value and competitive dynamics when assessing fairness.
03 Healthcare: The $67 Billion Pharmaceutical Merger
The second-largest transaction of 2025 involved the merger of two top-15 pharmaceutical companies, creating a combined entity with $142 billion in pro forma revenue and a leading position in oncology, immunology, and rare diseases. The all-stock transaction valued the target at $67 billion in enterprise value, representing one of the largest pharmaceutical mergers since the Bristol-Myers Squibb acquisition of Celgene in 2019.
Premium Analysis and Valuation Multiples
The transaction was structured at 4.8x forward revenue and 16.2x forward EBITDA, representing a 31% premium to the target's 30-day volume-weighted average price (VWAP). This premium sits at the upper end of the 25-35% range typical for large pharmaceutical transactions, reflecting both the quality of the target's pipeline and competitive tension from alternative bidders.
What makes this transaction particularly instructive for valuation professionals is the explicit pipeline value attribution. The acquirer's fairness opinion, prepared by a leading investment bank, allocated $23 billion of the $67 billion enterprise value to the target's clinical-stage pipeline, using probability-weighted discounted cash flow models for each asset. This represented 34% of total enterprise value, significantly higher than the 18-22% pipeline allocation typical in pharmaceutical M&A, reflecting the target's strong Phase III portfolio with five assets expected to reach market by 2028.
Synergy Quantification and Realization Timeline
The combined company projected $8.7 billion in annual run-rate synergies by year four post-close, with a present value of $42 billion using a 9.2% discount rate. The synergy composition was weighted heavily toward revenue synergies (58% of total), including $3.1 billion from accelerated commercialization of pipeline assets through the acquirer's global infrastructure, $2.0 billion from cross-selling opportunities in oncology, and $900 million from enhanced pricing power in certain therapeutic areas.
Cost synergies of $3.6 billion annually included $1.8 billion from R&D rationalization and site consolidation, $1.2 billion from manufacturing and supply chain optimization, and $600 million from SG&A reduction. The relatively modest cost synergy component—representing only 2.5% of combined revenue—reflects the challenges of achieving significant cost reductions in a highly regulated, R&D-intensive industry where headcount reductions can impair innovation capacity.
The premium-to-synergy ratio of 0.73x (premium of $13.1 billion divided by synergy PV of $42 billion) suggests that synergies more than justified the premium paid, with substantial value accretion potential for the acquirer's shareholders. This compares favorably to the 0.85-1.10x range observed in recent pharmaceutical mega-deals, indicating disciplined pricing relative to value creation potential.
04 Energy Transition: The $52 Billion Renewable Infrastructure Play
The energy sector's most significant transaction involved a major European utility's acquisition of a renewable energy platform with 47 GW of operating and development-stage wind and solar assets across North America and Europe. The $52 billion enterprise value represented the largest pure-play renewable energy transaction on record, signaling the sector's maturation and the increasing willingness of strategic buyers to deploy capital at scale in the energy transition.
Valuation Framework for Infrastructure Assets
Renewable energy infrastructure requires a distinct valuation approach compared to traditional corporate M&A, given the long-lived, contracted nature of cash flows and the importance of development pipeline value. The transaction was priced at 14.2x forward EBITDA for operating assets and incorporated a separate valuation for the 23 GW development pipeline using a probability-weighted approach based on permitting stage and power purchase agreement (PPA) status.
The acquirer paid a 28% premium to the target's unaffected trading price, below the 35-40% premiums typical in corporate M&A but consistent with infrastructure transactions where public market valuations more closely approximate intrinsic value due to the transparent, contracted cash flow profiles. The implied equity value of $38 billion represented a 5.8% dividend yield based on the target's forward distribution, providing a 180 basis point spread over the acquirer's cost of equity.
Deal Rationale: Scale, Integration, and Regulatory Positioning
The strategic rationale centered on achieving the scale necessary to compete for large-scale corporate PPA contracts and government renewable energy procurements, which increasingly favor counterparties with multi-gigawatt portfolios and proven execution capabilities. The combined entity's 89 GW of operating and development assets positions it as the second-largest renewable energy operator globally, with enhanced ability to secure favorable financing terms and equipment procurement pricing.
Synergies were projected at $2.1 billion annually by year three, representing a relatively modest 4.0% of combined revenue but a more meaningful 12% of combined EBITDA. The synergy composition was heavily weighted toward financing optimization ($900 million from refinancing existing debt at the acquirer's lower cost of capital), procurement efficiencies ($650 million from consolidated turbine and panel purchasing), and development cost reduction ($550 million from shared permitting, engineering, and construction management capabilities).
The transaction also incorporated $1.8 billion in estimated tax benefits from the U.S. Inflation Reduction Act's production and investment tax credits, which were explicitly valued in the purchase price allocation. This highlights the importance of understanding jurisdiction-specific incentive regimes when valuing renewable energy assets and the need for valuation professionals to incorporate these benefits in their discounted cash flow models.
05 Cross-Sector Patterns: Premium Structures and Synergy Multiples
Analyzing the 23 mega-deals announced in 2025 reveals several patterns that inform comparable transaction analysis and premium benchmarking. The median premium across all transactions was 33%, with a standard deviation of 8 percentage points, suggesting relatively consistent pricing discipline despite varying strategic rationales and sector dynamics.
Premium structures varied systematically by sector characteristics. Technology transactions averaged 36% premiums, reflecting competitive dynamics, scarcity value for leading platforms, and the difficulty of replicating proprietary technology through organic investment. Healthcare deals averaged 32% premiums, with higher premiums (38-42%) for targets with strong late-stage pipelines and lower premiums (24-28%) for mature, patent-exposed portfolios. Industrial and energy transactions averaged 29% premiums, consistent with more transparent asset values and lower growth expectations.
The relationship between premiums paid and synergy value provides critical insights for valuation professionals assessing deal rationale and fairness. Across the mega-deal population, the median synergy multiple (premium divided by synergy PV) was 0.92x, indicating that on average, quantified synergies approximately equaled the premium paid. However, this ratio varied significantly by transaction type:
- Horizontal mergers (same industry, overlapping operations): 0.68x median synergy multiple, reflecting substantial cost reduction opportunities that more than justify premiums
- Vertical integrations (supply chain consolidation): 1.15x median synergy multiple, with premiums partially justified by strategic positioning and supply security benefits beyond quantifiable synergies
- Diversifying acquisitions (new markets or capabilities): 1.43x median synergy multiple, indicating premiums substantially exceed synergy value and reflect strategic optionality and competitive positioning
These patterns underscore the importance of understanding deal rationale when selecting comparable transactions for valuation purposes. A horizontal merger in a mature industry provides limited comparability for a transformative, capability-building acquisition, even if both involve similar enterprise values and sector classifications.
06 Valuation Multiple Trends and Market Implications
The 2025 mega-deal population provides valuable benchmarks for current market multiples across sectors. The median EV/EBITDA multiple for transactions exceeding $10 billion was 13.8x forward EBITDA, representing a 12% discount to the 15.7x median observed in 2021 during the peak of the SPAC-driven M&A boom. This compression reflects both higher interest rates (despite recent declines) and more disciplined buyer behavior following several high-profile integration failures in 2022-2023.
However, multiple dispersion has increased significantly, with the interquartile range expanding from 3.2x in 2021 to 5.7x in 2025. This reflects growing differentiation between high-growth, technology-enabled businesses commanding 18-24x EBITDA and mature, capital-intensive businesses trading at 8-12x EBITDA. For valuation professionals, this dispersion emphasizes the importance of careful comparable selection based on growth profiles, margin structures, and capital intensity rather than simple sector classification.
Revenue multiples have proven more stable, with a median EV/Revenue multiple of 3.2x across the mega-deal population, compared to 3.4x in 2021. This stability reflects the offsetting effects of margin expansion in many industries (supporting higher revenue multiples) and increased cost of capital (compressing multiples). Software and technology transactions continued to command premium revenue multiples of 6.5-8.2x, while industrial and energy transactions traded at 1.2-2.1x revenue.
The expansion of multiple dispersion in 2025 mega-deals reinforces a critical principle: sector averages provide increasingly limited guidance for valuation. Company-specific growth, profitability, and competitive positioning drive valuation outcomes more than ever before.
07 Regulatory Considerations and Deal Certainty
The regulatory environment has significantly influenced 2025 mega-deal structures and valuations. Enhanced antitrust scrutiny, particularly in the United States and European Union, has extended average regulatory review periods to 14.3 months for transactions exceeding $25 billion, compared to 9.7 months in 2020. This extended timeline has several valuation implications that practitioners must consider.
First, reverse termination fees—the amount an acquirer must pay if the transaction fails to receive regulatory approval—have increased to a median of 7.8% of equity value for mega-deals, up from 5.2% in 2020. This reflects heightened regulatory risk and provides important context for assessing deal certainty and probability-weighting transaction outcomes in valuation analyses.
Second, acquirers have increasingly incorporated regulatory risk into their valuation models through higher discount rates or explicit probability adjustments. In three of the 23 mega-deals analyzed, acquirers disclosed using a 15-25% probability of regulatory rejection in their internal valuation models, effectively reducing their maximum willingness to pay by the inverse of this probability. This approach provides a more transparent framework for incorporating deal risk than traditional discount rate adjustments.
Third, several transactions have incorporated contingent value rights (CVRs) or earnout structures to bridge valuation gaps created by regulatory uncertainty. In the pharmaceutical mega-merger discussed earlier, $4.2 billion of the purchase price was structured as CVRs tied to successful FDA approval of three pipeline assets, effectively transferring regulatory risk from acquirer to seller and facilitating deal completion despite valuation disagreement.
08 Lessons for Valuation Professionals
The 2025 mega-deal landscape offers several critical lessons for valuation professionals conducting comparable transaction analyses, fairness opinions, or strategic valuations:
1. Synergy quantification requires rigorous, bottom-up analysis. The wide variation in synergy multiples across transactions demonstrates that generic assumptions (e.g., "synergies equal 10% of target revenue") provide inadequate precision for high-stakes valuations. Detailed, initiative-level synergy modeling with clear timelines and probability assessments has become the standard in mega-deal fairness opinions.
2. Premium analysis must account for competitive dynamics. The 33% median premium masks significant variation driven by auction processes, strategic buyer competition, and target negotiating leverage. In the five transactions that involved competitive bidding processes, premiums averaged 41%, compared to 28% for bilateral negotiations. Valuation professionals must understand deal process when benchmarking premiums.
3. Pipeline and development assets require separate valuation frameworks. Both the pharmaceutical and renewable energy mega-deals demonstrated the importance of explicitly valuing non-operating assets using probability-weighted approaches. Applying operating company multiples to development-stage assets systematically misstates value and can lead to material errors in purchase price allocations and goodwill calculations.
4. Regulatory risk has become a first-order valuation consideration. The extended timelines, elevated termination fees, and explicit probability adjustments observed in 2025 mega-deals indicate that regulatory risk can no longer be treated as a secondary consideration. Valuation models must incorporate these factors through appropriate probability weighting or scenario analysis.
5. Sector-specific metrics matter more than generic multiples. The renewable energy transaction's use of $/MW metrics and yield-based valuation, the pharmaceutical deal's pipeline value attribution, and the semiconductor transaction's design-manufacturing integration value all demonstrate that industry-specific value drivers must be explicitly modeled rather than subsumed into generic EBITDA multiples.
09 Forward-Looking Implications
As we move into the final quarter of 2025 and look toward 2026, several trends suggest continued robust mega-deal activity with evolving valuation dynamics. The combination of moderating interest rates, substantial private equity dry powder, and strategic imperatives for scale and capability building creates a supportive environment for large transactions.
However, valuation professionals should anticipate several shifts in deal structures and pricing dynamics. First, the increasing importance of AI and data assets will likely drive higher premiums for technology targets with proprietary datasets and model capabilities, potentially expanding the already-wide multiple dispersion we've observed. Second, geopolitical considerations—particularly supply chain resilience and regulatory fragmentation—will increasingly influence deal rationale and synergy quantification, requiring valuation professionals to incorporate these factors explicitly in their analyses.
Third, the growing sophistication of seller-side valuation and negotiation capabilities, supported by advanced analytics and comprehensive market intelligence, will likely compress the gap between premiums paid and intrinsic value. This trend places additional pressure on acquirers to develop rigorous, defensible valuation frameworks and on valuation professionals to provide increasingly granular, well-supported fairness opinions.
For practitioners conducting comparable transaction analyses or strategic valuations, the 2025 mega-deal population provides rich benchmarking data across multiple dimensions: premium structures, synergy multiples, regulatory timelines, and sector-specific metrics. However, the increasing complexity and customization of these transactions reinforces the importance of understanding deal-specific rationale and structure rather than relying on simple multiple averages.
Professional valuation platforms like iValuate have become essential tools for practitioners seeking to analyze comparable transactions efficiently, access current market multiples, and benchmark deal structures against historical precedents. As mega-deals continue to shape market expectations and valuation frameworks, the ability to rapidly access, analyze, and apply these insights will increasingly differentiate leading valuation professionals from their peers. The transactions of 2025 demonstrate that while fundamental valuation principles remain constant, their application requires ever-greater sophistication, analytical rigor, and market awareness—capabilities that iValuate helps professionals deliver consistently and efficiently.