Table of Contents11 sections
The industrial sector has entered a transformative consolidation phase in 2025-2026, driven by technological disruption, supply chain reconfiguration, and the imperative for scale in capital-intensive operations. For valuation professionals advising on transactions in manufacturing, logistics, and industrial services, understanding the nuances of transaction multiples in these asset-heavy businesses is critical to delivering accurate, defensible opinions of value.
Unlike asset-light technology or service businesses, industrial companies present unique valuation challenges. Their capital intensity, long-lived tangible assets, cyclical earnings patterns, and replacement value considerations fundamentally alter how market participants price acquisitions. This article examines current transaction multiples across industrial subsectors, explores the drivers behind valuation spreads, and provides practical frameworks for analyzing comparable transactions in this complex landscape.
01 The Current Industrial M&A Landscape
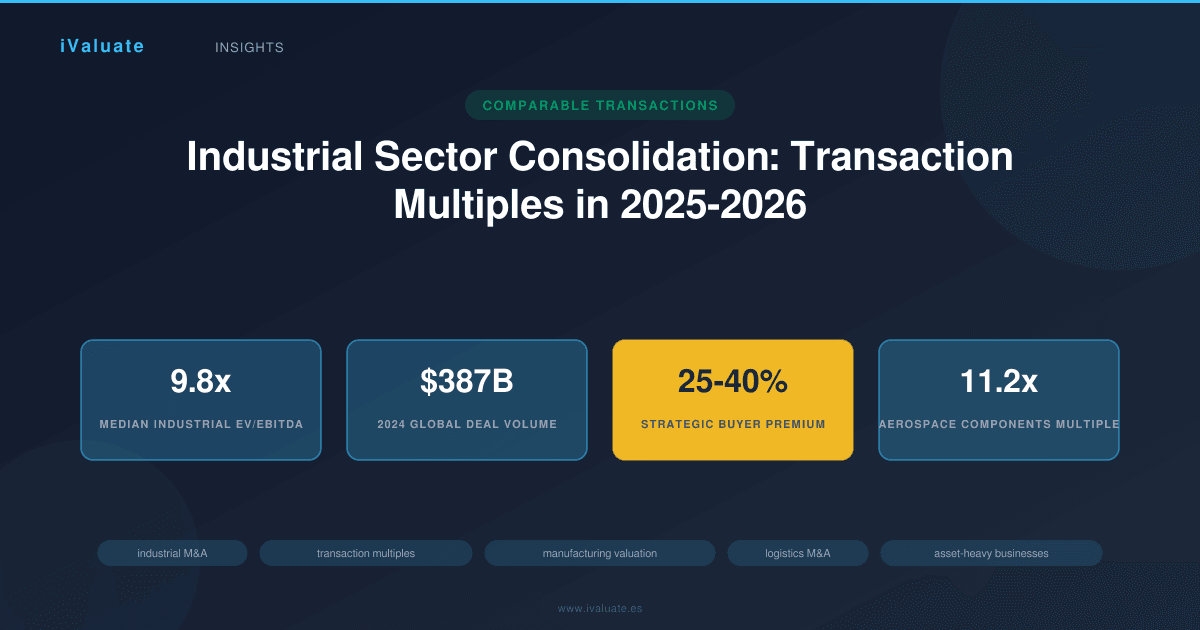
Industrial sector M&A activity in 2025-2026 reflects a market in transition. Total deal volume in the manufacturing and logistics sectors reached approximately $387 billion globally in 2024, representing a 14% increase from 2023 levels. This acceleration follows two years of subdued activity during the 2022-2023 interest rate shock, when elevated financing costs and economic uncertainty dampened transaction appetite.
Several structural forces are driving consolidation:
- Automation and Industry 4.0 adoption: Companies are acquiring capabilities in robotics, IoT integration, and advanced manufacturing systems rather than building them organically
- Supply chain resilience: Vertical integration and nearshoring strategies are prompting acquisitions of suppliers and logistics providers
- Energy transition: Industrial companies are consolidating to achieve the scale necessary for decarbonization investments
- Succession planning: An aging ownership base in mid-market industrial businesses is creating a wave of strategic and private equity exits
The median enterprise value-to-EBITDA (EV/EBITDA) multiple for industrial transactions in 2025 stands at 9.8x, compared to 8.4x in 2023. However, this headline figure masks significant variation across subsectors and deal characteristics. Strategic buyers are paying premiums of 25-40% over private equity multiples in certain segments, particularly where synergies can justify higher valuations.
02 Manufacturing Sector Transaction Multiples
Manufacturing businesses span a wide spectrum of capital intensity, technological sophistication, and end-market exposure. Transaction multiples reflect this diversity, with specialized manufacturers commanding premiums while commodity producers trade at discounts to the industrial average.
Discrete Manufacturing and Engineered Products
Companies producing complex, engineered products—aerospace components, precision machinery, specialized industrial equipment—have commanded the highest multiples in recent transactions. The median EV/EBITDA for this subsector reached 11.2x in 2025, with premium transactions exceeding 14x.
A representative transaction involved a mid-market aerospace component manufacturer with $85 million in revenue and $18 million in EBITDA. The company was acquired by a strategic buyer at 13.1x EBITDA, or approximately 1.8x revenue. Key valuation drivers included:
- Long-term contracts with tier-one OEMs providing revenue visibility
- Proprietary manufacturing processes creating barriers to entry
- AS9100 certification and established quality systems
- Modern equipment base with remaining useful life exceeding 15 years
The acquirer justified the premium multiple through anticipated cost synergies of $4.2 million annually and revenue synergies from cross-selling complementary product lines. On a pro forma basis accounting for synergies, the effective multiple dropped to 9.6x—within the strategic buyer's target acquisition range.
Process Manufacturing and Materials
Process manufacturers—chemicals, plastics, metals processing, building materials—typically trade at lower multiples due to commodity exposure, cyclical demand patterns, and higher capital intensity. The median EV/EBITDA for process manufacturing transactions in 2025 was 7.9x, though specialty chemical and advanced materials companies achieved 10-12x multiples.
Capital expenditure requirements significantly impact valuation in this subsector. Buyers carefully analyze maintenance capex as a percentage of revenue (typically 3-5% for process manufacturers) and growth capex requirements. A chemical processing company requiring $8-10 million in annual maintenance capex on $120 million in revenue will trade at a discount to a similar-sized business requiring only $3-4 million, even if reported EBITDA is comparable.
Replacement value becomes a critical consideration in asset-heavy process manufacturing. When a company's tangible asset base has a replacement cost of $150 million but generates only $12 million in EBITDA, buyers must reconcile the 12.5x implied asset multiple with market transaction multiples. In such cases, valuation often gravitates toward a weighted consideration of both income and asset approaches, particularly when the business operates in a mature, stable market where replacement cost provides a floor value.
03 Logistics and Distribution Multiples
The logistics sector has experienced dramatic multiple expansion over the past three years, driven by e-commerce growth, supply chain complexity, and the strategic value of distribution networks. However, significant valuation dispersion exists between asset-based logistics providers and asset-light freight brokers or 3PLs.
Asset-Based Transportation and Warehousing
Trucking companies, warehouse operators, and other asset-intensive logistics providers traded at a median 8.6x EBITDA in 2025, up from 7.2x in 2023. The multiple expansion reflects improved operating leverage as freight rates stabilized and capacity tightened following the 2023 downturn.
For asset-based logistics companies, valuation analysis must account for:
- Fleet age and composition: A trucking company with an average tractor age of 3.2 years will command a premium over one with 5.8-year-old equipment, as deferred replacement capex creates a hidden liability
- Real estate ownership: Logistics companies owning their distribution facilities often trade at premiums, as real estate value provides downside protection and strategic optionality
- Contract vs. spot revenue mix: Businesses with 70%+ contracted revenue achieve 1.5-2.0x higher multiples than those heavily exposed to spot market volatility
- Technology integration: Companies with advanced TMS, WMS, and route optimization systems command premiums of 15-25%
A recent transaction illustrates these dynamics: a regional warehousing and distribution company with $62 million in revenue and $11.5 million in EBITDA was acquired at 9.8x EBITDA. The company owned four strategically located distribution centers with a combined 1.2 million square feet, appraised at $94 million. The real estate represented 82% of the total enterprise value of $113 million, effectively valuing the operating business at just 2.1x EBITDA. This structure reflected the buyer's view that the real estate provided the primary strategic value, while the operating business generated acceptable but not exceptional returns on the asset base.
Asset-Light 3PL and Freight Brokerage
Third-party logistics providers and freight brokers operating with minimal hard assets have commanded premium multiples, typically 10-13x EBITDA for quality businesses. These companies benefit from higher returns on invested capital, scalability, and reduced capital intensity.
However, buyers scrutinize customer concentration, technology platforms, and carrier relationships carefully. A 3PL with its top three customers representing 55% of revenue will trade at a 20-30% discount to one with a more diversified customer base, reflecting key customer dependency risk. Similarly, companies with proprietary technology platforms enabling automated freight matching and dynamic pricing achieve meaningful premiums over those relying on manual processes and commodity services.
04 Industrial Services Transaction Dynamics
Industrial services encompass maintenance, repair, and operations (MRO) providers, equipment rental companies, industrial cleaning, and specialized technical services. This subsector has attracted significant private equity interest, driving multiple expansion and platform-plus-add-on consolidation strategies.
Median transaction multiples for industrial services reached 10.4x EBITDA in 2025, with platform acquisitions by well-capitalized private equity firms achieving 11-14x and add-on acquisitions to existing platforms trading at 7-9x. The valuation spread reflects the strategic premium for businesses that can serve as consolidation platforms versus those better suited as bolt-on acquisitions.
Recurring Revenue and Contract Value
Industrial services businesses with high recurring revenue percentages command substantial premiums. A facilities maintenance company with 80% of revenue from multi-year service contracts will trade at 12-13x EBITDA, while a similar-sized competitor with 40% recurring revenue might achieve only 8-9x.
Contract analysis is critical in these valuations. Buyers examine:
- Average contract length and renewal rates
- Pricing escalation clauses (particularly important in inflationary environments)
- Customer switching costs and service criticality
- Geographic density and route efficiency
A representative platform transaction involved an industrial equipment maintenance provider with $48 million in revenue, $9.2 million in EBITDA, and 73% recurring revenue from service contracts. The company was acquired by a private equity-backed platform at 12.6x EBITDA, or $116 million enterprise value. The buyer's thesis centered on using this business as a platform for consolidating fragmented regional competitors, with a target of completing 8-12 add-on acquisitions over 36 months.
Capital Equipment and Asset Intensity
Industrial services businesses requiring significant capital equipment—rental fleets, specialized tools, testing equipment—face valuation adjustments for asset intensity. A non-destructive testing company with $15 million in specialized equipment supporting $32 million in revenue will trade at lower multiples than a consulting-oriented industrial engineering firm with minimal hard assets, even if EBITDA margins are comparable.
Buyers adjust for capital intensity by analyzing:
- Maintenance capex as a percentage of revenue (typically 2-4% for industrial services)
- Equipment replacement cycles and technological obsolescence risk
- Asset utilization rates and capacity constraints
- Lease vs. own decisions and off-balance-sheet financing
The concept of normalized capex becomes critical. If a company has deferred equipment replacement for 2-3 years, reported EBITDA overstates sustainable cash generation. Buyers will normalize EBITDA downward to reflect appropriate ongoing capex, effectively reducing the valuation multiple on an as-reported basis.
05 The Role of Replacement Value in Industrial Valuations
Replacement value—the cost to recreate a company's productive capacity—plays a more prominent role in industrial sector valuations than in most other industries. For capital-intensive businesses, replacement value provides both a floor value in distressed scenarios and a ceiling in situations where returns on invested capital are inadequate.
Consider a metal fabrication company with $180 million in tangible assets (land, buildings, specialized equipment) generating $16 million in EBITDA. At a market multiple of 8.5x, the indicated enterprise value would be $136 million—substantially below the replacement cost of the asset base. In this scenario, several valuation considerations emerge:
- If the business operates in a stable market with barriers to new capacity additions, replacement value provides a floor, as no rational competitor would build new capacity at $180 million to generate $16 million in EBITDA
- If the market is oversupplied or in secular decline, the excess of replacement value over market value represents economic obsolescence—the assets are worth less than their reproduction cost because they generate inadequate returns
- If the company has significant excess capacity, a buyer might value the business based on utilized capacity replacement cost rather than total asset base
In practice, valuations for asset-heavy industrial companies often employ a weighted approach, considering both income-based multiples and asset-based indications. A company with strong market positions and solid returns might be valued at 70% income approach weight and 30% asset approach weight, while a marginal performer in a mature market might receive 40% income weight and 60% asset weight.
06 Adjusting Multiples for Capital Intensity
When comparing transaction multiples across industrial companies with varying capital intensity, several adjustments improve comparability:
EV/EBITDA Less Maintenance Capex
This metric, sometimes called EV/EBITDA-Capex or the unlevered free cash flow multiple, accounts for the ongoing capital requirements to maintain productive capacity. A company trading at 9.5x EBITDA but requiring 4.5% of revenue in maintenance capex may be less attractive than one at 10.5x EBITDA requiring only 2% maintenance capex.
For a $100 million revenue company with $15 million EBITDA and $4.5 million maintenance capex, the EV/EBITDA-Capex multiple at 9.5x EBITDA ($142.5 million EV) would be 13.6x. A comparable company with $14 million EBITDA but only $2 million capex, trading at 10.5x EBITDA ($147 million EV), would have an EV/EBITDA-Capex multiple of 12.3x—actually more attractive despite the higher headline multiple.
EV/Invested Capital Ratios
Examining enterprise value as a multiple of invested capital (tangible assets plus working capital) provides insight into how the market values asset productivity. Industrial companies generating strong returns on invested capital—15% or higher—typically trade at EV/IC ratios of 1.5-2.5x, while those with marginal returns (8-10%) trade closer to 1.0-1.3x.
This metric proves particularly valuable when evaluating acquisition opportunities in mature, capital-intensive industries. A potential acquisition trading at 1.1x invested capital in a stable market may represent attractive value, as the downside is protected by the asset base while any operational improvements flow directly to equity value.
07 Sector-Specific Multiple Ranges: 2025-2026 Data
Based on analysis of 340+ industrial sector transactions completed between January 2024 and March 2026, the following multiple ranges represent current market conditions:
Aerospace & Defense Manufacturing: 10.5x - 14.2x EBITDA (median 11.8x)
Automotive Components: 7.2x - 9.8x EBITDA (median 8.1x)
Industrial Machinery: 8.9x - 12.4x EBITDA (median 10.2x)
Specialty Chemicals: 9.8x - 13.1x EBITDA (median 11.2x)
Commodity Chemicals: 6.5x - 8.9x EBITDA (median 7.4x)
Building Products: 7.8x - 10.6x EBITDA (median 8.9x)
Asset-Based Logistics: 7.5x - 10.2x EBITDA (median 8.6x)
3PL & Freight Brokerage: 9.2x - 13.5x EBITDA (median 10.8x)
Industrial Services (Platform): 10.5x - 14.8x EBITDA (median 12.1x)
Industrial Services (Add-on): 6.8x - 9.5x EBITDA (median 7.9x)
These ranges reflect transactions with enterprise values between $25 million and $500 million. Larger transactions (>$500 million) typically command premiums of 10-20%, while smaller deals (<$25 million) often trade at discounts of 15-25% due to illiquidity and business concentration risks.
08 Quality of Earnings and Normalization Adjustments
Industrial sector transactions require particularly rigorous quality of earnings analysis due to cyclical demand patterns, lumpy capex, and potential for deferred maintenance. Common normalization adjustments include:
- Cyclical revenue normalization: Adjusting recent results to reflect mid-cycle demand rather than peak or trough conditions
- Deferred maintenance: Reducing EBITDA for inadequate historical capex or maintenance spending
- Excess inventory: Adjusting working capital for above-normal inventory levels that will require liquidation
- Environmental remediation: Reserving for known or probable environmental liabilities
- Customer concentration: Risk-adjusting for revenue concentration in top customers
- Related party transactions: Normalizing for above- or below-market pricing with affiliated entities
In a recent transaction involving a metal processing company, quality of earnings analysis identified $2.8 million in deferred maintenance capex that had been postponed during a period of weak demand. While reported EBITDA was $14.2 million, normalized EBITDA adjusting for appropriate capex was $11.4 million—a 20% reduction that materially impacted valuation. The buyer structured the transaction at 8.2x normalized EBITDA rather than the initially proposed 9.0x reported EBITDA, resulting in a $15 million reduction in enterprise value.
09 The Impact of Interest Rates and Financing Structures
The industrial sector's capital intensity makes it particularly sensitive to financing costs. The rise in interest rates during 2022-2023 (with the federal funds rate reaching 5.25-5.50%) compressed multiples as buyers faced higher costs of capital. The modest rate reductions in late 2024 and early 2025 (currently 4.50-4.75%) have supported multiple recovery, though financing remains more expensive than the 2020-2021 period.
Leveraged buyout (LBO) economics for industrial companies typically support 4.5-5.5x debt-to-EBITDA for quality businesses with stable cash flows. Asset-based lending provides additional capacity, with lenders willing to advance 75-85% against eligible receivables and 50-65% against eligible inventory. For asset-heavy manufacturers, equipment financing can supplement traditional senior debt, though at higher costs (typically 8-11% for equipment loans versus 6.5-8.5% for senior secured facilities).
Private equity buyers typically target 20-25% IRRs in industrial platform investments, requiring entry multiples that allow for multiple arbitrage on exit. A fund acquiring at 10x EBITDA needs to achieve either significant EBITDA growth or multiple expansion to reach target returns. This dynamic has led sophisticated buyers to focus on operational value creation—margin improvement, working capital optimization, add-on acquisitions—rather than relying solely on multiple expansion.
10 Cross-Border Considerations and Regional Variations
Industrial sector multiples vary significantly across geographies, reflecting different economic conditions, regulatory environments, and market maturity. North American industrial transactions in 2025 averaged 9.8x EBITDA, while European deals averaged 8.6x and Asian transactions (excluding China) averaged 7.9x.
Several factors drive these regional variations:
- Economic growth expectations: Regions with stronger GDP growth forecasts support higher multiples
- Capital availability: Markets with deeper private equity and strategic buyer pools achieve higher valuations
- Regulatory environment: Jurisdictions with complex labor laws, environmental regulations, or foreign ownership restrictions trade at discounts
- Currency and political risk: Emerging markets face discount rates 300-500 basis points higher than developed markets
Cross-border transactions often involve additional complexity in valuation. A European strategic buyer acquiring a U.S. manufacturer must consider currency hedging costs, tax structuring, integration challenges, and potential tariff implications. These factors typically result in 5-10% lower multiples for cross-border deals compared to domestic transactions, though strategic rationale can overcome this discount.
11 Looking Ahead: Industrial M&A in 2026 and Beyond
The industrial sector consolidation wave shows no signs of abating. Several trends will likely influence transaction multiples through 2026 and beyond:
Automation and digitalization premiums: Companies demonstrating advanced manufacturing capabilities, IoT integration, and data analytics will command increasing premiums—potentially 20-30% above traditional manufacturers by late 2026.
Sustainability and ESG factors: Industrial companies with strong environmental performance, carbon reduction roadmaps, and circular economy business models are beginning to achieve valuation premiums. While difficult to quantify precisely, early evidence suggests 10-15% multiple premiums for ESG leaders versus laggards in the same subsector.
Supply chain resilience value: Companies with diversified supplier bases, nearshore manufacturing capabilities, and supply chain visibility tools will be valued for risk mitigation, not just current financial performance.
Succession-driven deal flow: The aging of baby boomer business owners will continue driving mid-market industrial M&A, with an estimated $2-3 trillion in business value changing hands over the next decade.
For valuation professionals, these dynamics require continuous monitoring of market data, rigorous comparable transaction analysis, and deep sector expertise. The complexity of industrial valuations—balancing income, market, and asset approaches while accounting for capital intensity, cyclicality, and strategic considerations—demands sophisticated analytical tools and frameworks.
Platforms like iValuate enable professionals to efficiently analyze comparable transactions, adjust for company-specific factors, and generate defensible valuation conclusions in this complex sector. As industrial consolidation accelerates and transaction structures become more sophisticated, the ability to quickly access relevant market data and apply rigorous analytical frameworks will increasingly differentiate leading advisory practices from the rest of the field.
The industrial sector's transformation—driven by technology, sustainability imperatives, and generational ownership transitions—creates both challenges and opportunities for M&A professionals. Understanding the nuances of transaction multiples in manufacturing, logistics, and industrial services is essential for delivering value to clients navigating this dynamic landscape. Those who master the interplay between asset intensity, replacement value, and market-based valuation will be best positioned to advise on the industrial transactions shaping the economy of the next decade.