Table of Contents7 sections
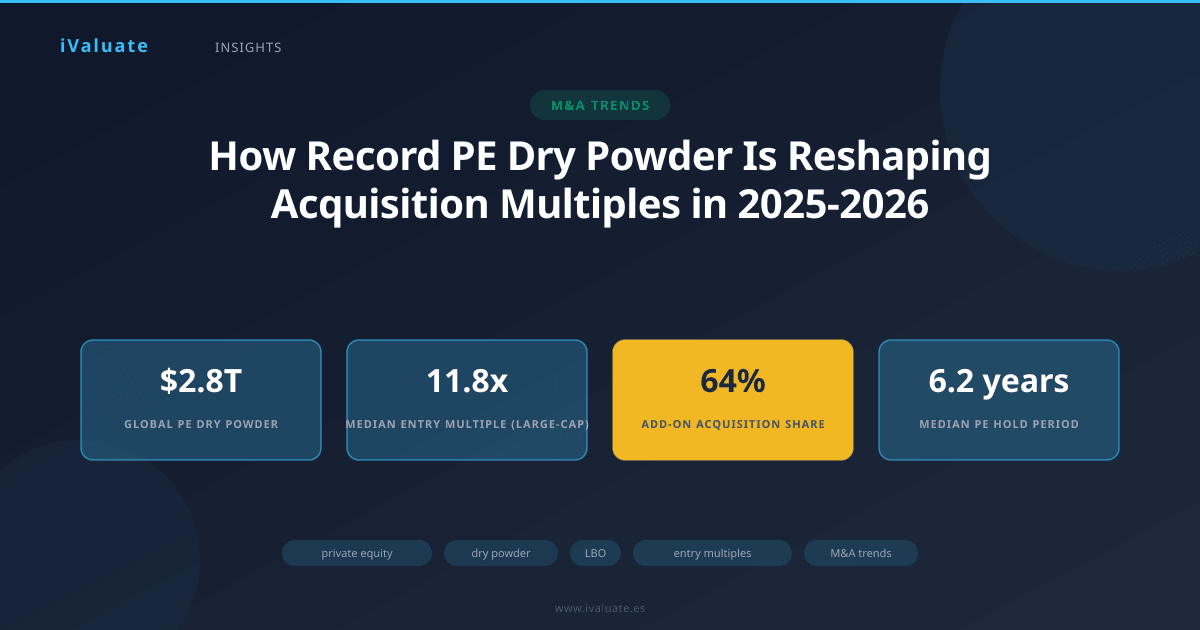
Private equity firms entered 2025 with an unprecedented challenge: deploying a record $2.8 trillion in dry powder while navigating elevated interest rates, heightened regulatory scrutiny, and intensifying competition for quality assets. This capital overhang—representing committed but uninvested funds—has created a profound imbalance between supply and demand in the M&A market, pushing acquisition multiples to levels that would have been considered unsustainable just five years ago.
The implications extend far beyond headline valuation figures. This dry powder phenomenon is reshaping deal structures, altering return expectations, transforming sector dynamics, and forcing both buyers and sellers to recalibrate their strategic approaches. For CFOs considering exit options, M&A advisors structuring transactions, and PE professionals seeking competitive advantages, understanding these dynamics has become essential to successful deal execution.
01 The Anatomy of the Dry Powder Surge
Private equity dry powder represents capital that limited partners have committed to PE funds but that remains uninvested. This capital typically has a defined investment period—usually five to six years from the fund's first close—creating inherent pressure on general partners to deploy capital or risk returning it to investors.
The current dry powder accumulation stems from several converging factors. First, fundraising has remained robust despite market volatility. Global PE fundraising reached $647 billion in 2024, with North American funds accounting for approximately 58% of this total. Institutional investors—particularly pension funds, sovereign wealth funds, and family offices—have maintained or increased their PE allocations, viewing the asset class as essential for portfolio diversification and return generation.
Second, deployment rates have lagged fundraising. The combination of elevated purchase price multiples, financing market disruptions in 2022-2023, and economic uncertainty caused many PE firms to adopt a more cautious deployment stance. While deal activity rebounded in late 2024 and early 2025, it hasn't kept pace with capital inflows. The result: dry powder as a percentage of total PE assets under management reached 29.4% in Q1 2025, the highest level since 2009.
Third, fund life cycles have created a deployment imperative. Many funds raised in 2019-2021 are now in years four through six of their investment periods, meaning GPs face mounting pressure to put capital to work or lose the opportunity entirely. This time-bound urgency has intensified competition for attractive assets and reduced price sensitivity among certain buyers.
Geographic and Sector Concentration
The dry powder distribution reveals important nuances. North American-focused funds hold approximately $1.2 trillion, European funds $680 billion, and Asia-Pacific funds $520 billion. Within these regions, sector concentration varies significantly. Technology-focused funds account for roughly $485 billion globally, healthcare funds $390 billion, and industrials funds $340 billion.
This concentration matters because it creates sector-specific valuation pressure. In software and technology services, where multiple mega-funds are competing for a limited universe of high-quality assets generating $50-200 million in EBITDA, entry multiples have reached 13.5-15.0x EBITDA for best-in-class businesses—200-300 basis points above historical norms. Healthcare services and specialty pharmaceuticals have experienced similar dynamics, with premium assets commanding 12.0-14.5x multiples.
02 Multiple Expansion Across the Market Spectrum
The impact of elevated dry powder on acquisition multiples manifests differently across deal size segments and sectors. In the large-cap market (enterprise values exceeding $1 billion), median EV/EBITDA multiples reached 11.8x in Q1 2025, compared to 10.2x in 2019 and 9.4x in 2015. This 260-basis-point increase over six years represents significant multiple expansion, particularly given that the period includes a major interest rate hiking cycle.
The middle market—traditionally defined as companies with enterprise values between $100 million and $1 billion—has experienced even more pronounced multiple expansion. Median multiples in this segment reached 10.4x in Q1 2025, up from 8.7x in 2019. The compression of the multiple differential between large-cap and middle-market deals reflects the democratization of dry powder, with a proliferation of funds targeting the $500 million to $2 billion fund size range.
Sector-Specific Dynamics
Technology and software businesses continue to command premium valuations, though the stratospheric multiples of 2020-2021 have moderated. High-growth SaaS businesses with 30%+ revenue growth, strong retention metrics, and clear paths to profitability now trade at 11.0-14.0x revenue multiples in the private markets, compared to 15.0-20.0x at the peak. On an EBITDA basis, profitable software companies with predictable recurring revenue command 14.0-16.0x multiples for quality assets.
Healthcare services has emerged as one of the most competitive sectors, driven by favorable demographic trends, regulatory tailwinds, and strong defensive characteristics. Specialty healthcare services businesses—particularly those in dental, veterinary, dermatology, and behavioral health—routinely attract 11.5-13.5x EBITDA multiples. Platform acquisitions in fragmented subsectors often exceed these ranges, with some transactions reaching 15.0x for businesses demonstrating exceptional growth and margin profiles.
Industrial and manufacturing businesses have experienced more modest multiple expansion, though quality assets still command premium valuations. Companies serving non-cyclical end markets, possessing proprietary technology, or demonstrating pricing power trade at 9.5-11.5x EBITDA, while more commoditized businesses remain in the 7.0-9.0x range. The bifurcation within industrials has widened, with the multiple spread between top-quartile and median assets expanding from 2.5x in 2019 to 3.8x in 2025.
The fundamental challenge facing PE firms today isn't finding capital—it's finding assets that can generate acceptable returns at current entry multiples while competing against dozens of well-capitalized competitors.
03 The LBO Model Under Pressure
Traditional leveraged buyout economics relied on a balanced return equation: modest entry multiples (7.0-9.0x EBITDA), significant leverage (5.0-6.0x debt-to-EBITDA), operational improvements generating 200-400 basis points of EBITDA margin expansion, and exit multiples at or slightly above entry levels. This formula consistently generated 20-25% IRRs with reasonable risk profiles.
Current market dynamics have disrupted each component of this equation. Entry multiples, as discussed, have expanded significantly. Leverage multiples, while recovering from 2022-2023 lows, remain constrained relative to the pre-pandemic environment. Senior lenders typically cap leverage at 4.5-5.5x EBITDA for most middle-market transactions, with total leverage (including subordinated debt and preferred equity) reaching 5.5-6.5x for well-structured deals. This represents a 0.5-1.0x reduction from peak leverage levels.
Interest rates compound the challenge. With base rates 400-500 basis points above 2019-2021 levels, the cost of debt has increased substantially. A typical middle-market LBO in Q1 2025 carries a weighted average cost of debt of 9.5-11.0%, compared to 5.5-6.5% in 2021. On a $500 million transaction with 5.0x leverage, this translates to an additional $100-137.5 million in interest expense over a five-year hold period—capital that directly reduces equity returns.
Adapting the Return Formula
PE firms have responded to these pressures through several adaptations. First, operational value creation has become paramount. Firms are investing more heavily in operational resources, bringing in specialized operating partners, and implementing more aggressive transformation initiatives. The expectation for EBITDA growth during the hold period has increased from 8-12% annually to 12-18% for many firms.
Second, buy-and-build strategies have intensified. By acquiring platform companies and executing programmatic add-on acquisitions, PE firms can create value through multiple arbitrage (buying smaller companies at lower multiples and incorporating them into a larger platform commanding higher multiples) and operational synergies. In 2024, add-on acquisitions represented 64% of all PE-backed transactions by count, up from 52% in 2019.
Third, hold periods have extended. The median hold period for PE-backed exits reached 6.2 years in 2024, compared to 5.1 years in 2019. Longer hold periods allow more time for operational improvements to compound and provide optionality to exit during favorable market windows. However, extended holds also increase the denominator in IRR calculations, requiring stronger absolute returns to maintain target IRRs.
04 Real-World Case Studies
Case Study 1: Healthcare Services Platform
In Q2 2024, a large-cap PE firm acquired a specialty healthcare services platform for 12.8x EBITDA—a multiple that would have been considered aggressive for the sector just three years earlier. The company generated $185 million in EBITDA with strong unit-level economics and presence in a fragmented market with significant consolidation runway.
The firm structured the transaction with 4.8x leverage and committed to an aggressive buy-and-build strategy targeting 15-20 add-on acquisitions over four years. The thesis centered on multiple arbitrage (acquiring smaller practices at 7.0-9.0x and incorporating them into a platform valued at 12.0-13.0x), operational improvements through centralized services and technology implementation, and revenue synergies through cross-selling.
To achieve a 22% IRR at the entry multiple, the firm needed to more than double EBITDA over five years and exit at 11.5-12.5x—requiring flawless execution of the buy-and-build strategy and sustained sector multiples. The deal illustrates how elevated entry multiples have increased execution risk and reduced margin for error in PE investments.
Case Study 2: Software Carve-Out
A mid-market PE firm acquired a software division from a Fortune 500 company in Q4 2024 for 11.2x EBITDA. The business generated $42 million in EBITDA with 85% recurring revenue, strong customer retention, and modest growth (8% annually). The carve-out nature created complexity but also opportunity—the business had been under-invested and operated with corporate overhead that could be eliminated.
The PE firm structured the acquisition with 4.2x leverage and developed a detailed 100-day plan focused on sales and marketing investment, product development acceleration, and cost structure optimization. The thesis projected EBITDA growth to $78 million over five years through organic growth acceleration (from 8% to 15% annually) and margin expansion (from 32% to 38%).
At an exit multiple of 11.0x, this would generate a 2.0x equity multiple and 19% IRR—acceptable but below the firm's 25% target. The deal proceeded based on conviction in the operational plan and the defensive characteristics of the business. It exemplifies how PE firms are accepting lower return profiles for quality assets in competitive markets.
Case Study 3: Industrial Manufacturing
A lower-middle-market PE firm acquired a specialized industrial manufacturer in Q1 2025 for 8.9x EBITDA—a relatively modest multiple reflecting the company's cyclical end markets and limited growth profile. The business generated $28 million in EBITDA with strong market positions in niche applications but faced margin pressure from input cost inflation.
The firm saw opportunity in operational improvements that the family-owned business had not pursued: implementing lean manufacturing, optimizing the supply chain, expanding into adjacent products, and professionalizing sales and marketing. The thesis projected EBITDA growth to $44 million over five years through margin expansion and modest revenue growth.
With 5.2x leverage and an assumed exit multiple of 9.0x, the projected returns exceeded 25% IRR. This transaction illustrates that attractive returns remain achievable for firms willing to pursue operationally intensive investments in less competitive sectors, though these opportunities are increasingly scarce as dry powder flows into all market segments.
05 Strategic Implications for Market Participants
For Private Equity Firms
PE firms must fundamentally recalibrate their approach to investing in this environment. Source differentiation has become critical—firms that can access proprietary deal flow through industry relationships, operational expertise, or creative transaction structures maintain pricing advantages. Several large PE firms have established dedicated origination teams focused on proactive sourcing rather than reactive auction participation.
Operational capabilities increasingly differentiate winners from losers. Firms with deep operational resources, proven value creation playbooks, and track records of executing complex transformations can underwrite higher entry multiples with confidence. This has accelerated the institutionalization of PE operations groups, with leading firms employing 50-100+ operating professionals.
Portfolio construction and fund strategy require careful consideration. Some firms have shifted toward strategies less dependent on multiple arbitrage—such as growth equity, where returns derive primarily from revenue and earnings growth rather than multiple expansion. Others have embraced longer hold periods and lower leverage, accepting that 15-18% IRRs may be the new normal for traditional LBO strategies.
For Sellers and Business Owners
The current environment presents extraordinary opportunities for business owners considering exits. Multiple expansion driven by dry powder has created a seller's market in most sectors, particularly for high-quality businesses with growth profiles and defensible competitive positions.
However, sellers must recognize that elevated multiples come with heightened buyer expectations. PE firms paying premium prices expect premium performance—aggressive growth targets, operational improvements, and management teams capable of executing transformation agendas. Sellers should prepare businesses for institutional ownership by professionalizing financial reporting, documenting operational processes, and assembling management teams with relevant experience.
Timing considerations remain important despite favorable market conditions. While dry powder suggests sustained demand for quality assets, multiple factors could disrupt valuations: economic recession, credit market disruption, regulatory changes affecting PE economics, or shifts in institutional investor appetite for the asset class. Sellers with flexibility should evaluate market conditions holistically rather than assuming current multiples will persist indefinitely.
For M&A Advisors
Investment bankers and M&A advisors must adapt their processes to maximize value in this competitive environment. Targeted auction processes that create competitive tension among 8-12 qualified buyers often generate better outcomes than broad auctions that attract 40+ participants but lack focus. Identifying buyers with strategic rationale beyond financial returns—such as platform companies seeking add-ons or PE firms with specific sector expertise—can drive premium valuations.
Deal positioning has become increasingly sophisticated. Advisors must articulate clear value creation opportunities, provide detailed operational analysis, and develop financial projections that balance credibility with ambition. PE buyers are sophisticated and skeptical—generic growth stories without substantiation rarely command premium multiples.
Process management requires careful orchestration. In markets with abundant capital, creating urgency and maintaining momentum becomes critical. Advisors should establish clear timelines, enforce disciplined bidding procedures, and leverage competitive dynamics to drive optimal outcomes.
06 The Road Ahead: Structural Changes and Future Outlook
The elevated dry powder environment appears likely to persist through 2026 and potentially beyond. Fundraising remains robust, with many large PE firms in market with successor funds. Institutional investors show no signs of reducing PE allocations—indeed, many are increasing exposure to meet return targets in a low-yield environment.
However, several factors could alter the trajectory. First, a significant economic downturn would impact both deployment and fundraising, potentially reducing dry powder accumulation. Second, sustained higher interest rates could make levered returns more challenging, causing some investors to reconsider PE allocations. Third, regulatory changes—particularly around carried interest taxation or fund structures—could affect the economics of PE investing.
The more likely scenario involves gradual normalization rather than dramatic disruption. As deployment accelerates and funds mature, dry powder as a percentage of AUM should decline from current elevated levels. Multiple expansion will likely moderate, with valuations stabilizing at levels 100-150 basis points above historical norms rather than continuing to increase. This would create a more balanced market while maintaining favorable conditions for quality assets.
PE firms that adapt their strategies to this new reality—embracing operational value creation, extending hold periods, and accepting modestly lower returns—will continue to generate attractive risk-adjusted returns. Those clinging to outdated models predicated on multiple arbitrage and financial engineering will struggle.
07 Conclusion: Navigating the New Normal
Record private equity dry powder has fundamentally reshaped acquisition multiples and deal dynamics across sectors. Entry multiples have expanded 200-300 basis points across most segments, leverage has declined, and interest costs have increased substantially. These changes have compressed returns in traditional LBO models and forced PE firms to emphasize operational value creation, programmatic M&A, and longer hold periods.
For sellers, the environment presents exceptional opportunities to achieve premium valuations, particularly for businesses with strong growth profiles, defensible competitive positions, and professional management teams. For PE buyers, success requires operational excellence, creative deal sourcing, and realistic return expectations. For advisors, maximizing value demands sophisticated positioning, targeted processes, and skilled negotiation.
The dry powder phenomenon reflects both the maturation of private equity as an asset class and the challenges inherent in deploying unprecedented amounts of capital. While elevated multiples create risks—particularly if economic conditions deteriorate or exit markets contract—they also reflect genuine competition for quality assets among well-capitalized, sophisticated buyers.
As market participants navigate this complex environment, having access to accurate, real-time valuation data and sophisticated analytical tools becomes increasingly important. Platforms like iValuate enable professionals to benchmark valuations against current market multiples, analyze comparable transactions, and develop defensible valuation ranges that reflect actual market conditions rather than outdated assumptions. In a market where 50-100 basis points of multiple can represent millions of dollars in transaction value, precision in valuation analysis has never been more critical.
The private equity industry has consistently demonstrated adaptability in the face of changing market conditions. The current dry powder environment presents challenges, but also opportunities for firms that embrace operational excellence, creative transaction structures, and realistic return expectations. As we progress through 2025 and 2026, the firms that thrive will be those that recognize that sustainable value creation—rather than financial engineering—has become the primary driver of PE returns in this new era.