Table of Contents10 sections
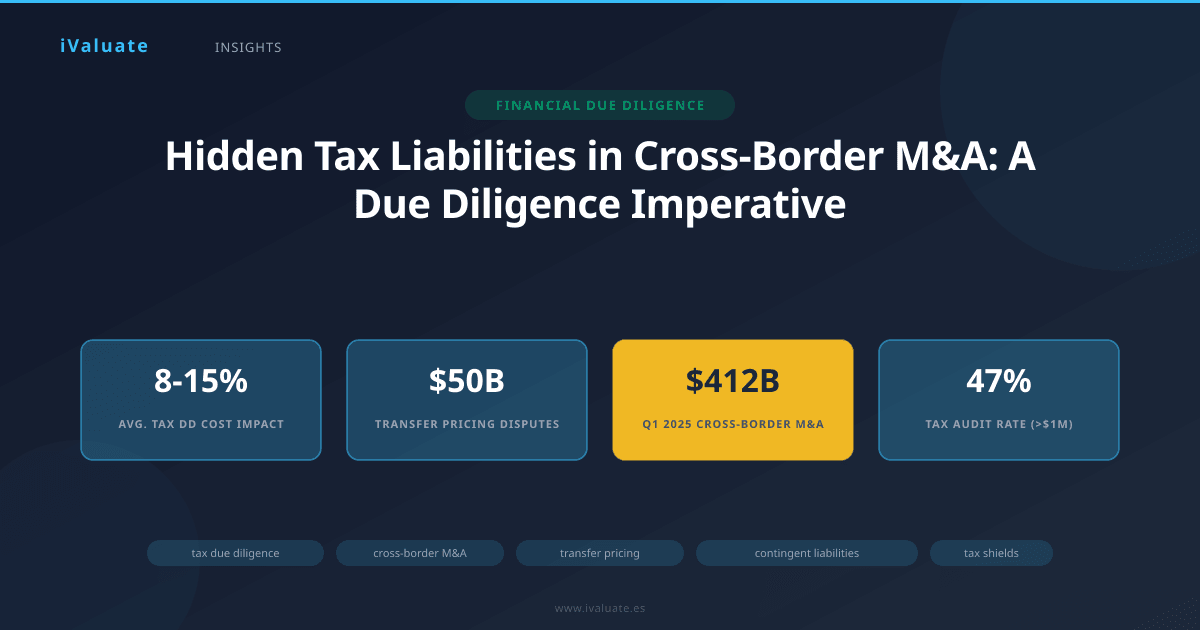
In the first quarter of 2025, cross-border M&A activity reached $412 billion globally, marking a 23% increase from the prior year as dealmakers capitalized on currency arbitrage opportunities and regulatory harmonization in key markets. Yet beneath this resurgence lies a sobering reality: inadequate tax due diligence continues to erode equity value in international transactions, with post-closing tax disputes costing acquirers between 8% and 15% of purchase price on average, according to recent PwC and Deloitte transaction advisory data.
The complexity of cross-border tax structures has intensified dramatically since the OECD's Pillar Two global minimum tax framework took effect in January 2024, affecting multinational enterprises with revenues exceeding €750 million. Combined with heightened transfer pricing scrutiny, evolving permanent establishment rules, and aggressive tax authority enforcement across jurisdictions, the stakes for comprehensive tax due diligence have never been higher.
01 The Anatomy of Tax Due Diligence in Cross-Border Transactions
Tax due diligence in international M&A extends far beyond reviewing historical tax returns. It requires a forensic examination of the target's global tax position, encompassing current liabilities, contingent exposures, structural inefficiencies, and the sustainability of historical tax benefits. The process typically unfolds across four critical dimensions:
- Historical compliance review: Verification of tax return filings, payment histories, and audit outcomes across all relevant jurisdictions for the past 3-7 years (statute of limitations varies by country)
- Structural analysis: Assessment of legal entity structures, intercompany arrangements, intellectual property ownership, and cross-border financing mechanisms
- Contingent liability identification: Quantification of potential exposures from open tax years, aggressive positions, transfer pricing disputes, and regulatory changes
- Tax attribute validation: Verification and valuation of net operating losses (NOLs), tax credits, and other shields that contribute to post-acquisition value
For a typical mid-market cross-border transaction valued at $250-500 million, comprehensive tax due diligence requires 200-400 hours of specialized work across multiple jurisdictions, with costs ranging from $150,000 to $450,000 depending on the target's geographic footprint and structural complexity.
02 Transfer Pricing: The $50 Billion Blind Spot
Transfer pricing represents the single largest source of hidden tax liability in cross-border acquisitions. The OECD estimates that transfer pricing disputes globally involve approximately $50 billion in contested tax assessments at any given time, with resolution timelines averaging 4-6 years from initial challenge to final settlement.
Transfer pricing risk manifests when intercompany transactions—including sales of goods, provision of services, licensing of intellectual property, and intercompany financing—fail to reflect arm's length pricing principles. Tax authorities increasingly deploy sophisticated economic analysis and comparable company benchmarking to challenge historical transfer pricing positions, often years after transactions occurred.
Common Transfer Pricing Vulnerabilities
In our advisory practice, we consistently observe several high-risk transfer pricing scenarios that escape initial due diligence scrutiny:
Intellectual property migration without adequate compensation: When companies relocate IP to low-tax jurisdictions (Ireland, Singapore, Switzerland) without documenting appropriate buy-in payments or cost-sharing arrangements, they create latent exposure. A 2024 case involving a European pharmaceutical company resulted in a €340 million assessment when German tax authorities challenged an IP transfer to Ireland completed eight years prior.
Management fee arrangements lacking economic substance: Intercompany management fees and service charges frequently lack contemporaneous documentation demonstrating actual services rendered, arm's length pricing, and economic benefit to the recipient. Tax authorities in high-tax jurisdictions (Germany, France, Japan) have become particularly aggressive in disallowing these deductions, with success rates exceeding 60% in formal disputes.
Financing structures with excessive debt loading: Intercompany loans that create interest deductions in high-tax jurisdictions while generating income in low-tax entities face dual challenges: thin capitalization rules limiting interest deductibility and transfer pricing scrutiny of interest rates charged. The implementation of BEPS Action 4 (interest limitation rules) across OECD countries has made historical financing structures increasingly vulnerable to challenge.
A 2025 survey of 240 corporate tax directors revealed that 67% had experienced transfer pricing audits in the past three years, with 42% resulting in material adjustments exceeding $5 million. The median settlement involved payment of 65% of the initially assessed amount plus interest.
Quantifying Transfer Pricing Exposure
Sophisticated tax due diligence employs economic modeling to quantify potential transfer pricing exposure. The methodology typically involves:
- Benchmarking analysis comparing the target's intercompany pricing to comparable uncontrolled transactions using databases such as Bureau van Dijk, S&P Capital IQ, and Bloomberg
- Functional analysis assessing the economic substance of entities involved in intercompany transactions
- Risk-weighting based on jurisdiction-specific audit likelihood, statute of limitations, and historical authority positions
- Monte Carlo simulation modeling potential assessment ranges and settlement probabilities
For a manufacturing company with $800 million in annual intercompany transactions across 15 jurisdictions, a comprehensive transfer pricing risk assessment might identify $45-85 million in potential exposure (representing 5-10% of intercompany volume), with a probability-weighted expected value of $18-25 million after considering settlement likelihood and statute of limitations.
03 Contingent Tax Liabilities: Beyond the Balance Sheet
Contingent tax liabilities represent probable or possible obligations that may arise from past events but remain unrecognized on the target's balance sheet due to uncertainty regarding timing, amount, or occurrence. Under ASC 450 (US GAAP) and IAS 37 (IFRS), companies must disclose contingent liabilities when the probability of occurrence exceeds 50%, but many targets adopt aggressive disclosure thresholds or fail to identify exposures entirely.
Categories of Material Contingent Tax Exposure
Permanent establishment (PE) risk: The threshold for creating taxable presence in foreign jurisdictions has lowered significantly following BEPS implementation. Companies with sales personnel, technical support staff, or even sustained digital presence in foreign markets may have inadvertently created PE, triggering corporate income tax obligations and potential penalties for non-filing. A 2024 technology sector study found that 38% of software companies with international sales had unrecognized PE exposure in at least one jurisdiction.
Indirect tax exposures: Value-added tax (VAT), goods and services tax (GST), and sales tax compliance failures often escape income tax-focused due diligence. These exposures can be substantial: a recent cross-border acquisition of a European e-commerce business revealed €12 million in unremitted VAT across six EU member states, representing 18% of the transaction's equity value. Indirect tax authorities typically assess penalties of 20-40% on top of unpaid tax, and criminal liability may attach in cases of sustained non-compliance.
Withholding tax deficiencies: Cross-border payments for services, royalties, interest, and dividends typically trigger withholding tax obligations in the source country. Failure to withhold and remit creates joint and several liability for both payer and recipient. We recently advised on a transaction where the target had failed to withhold tax on $67 million in intercompany royalty payments over four years, creating a $10.7 million exposure (including penalties and interest) that reduced equity value by 8.3%.
Tax incentive clawback provisions: Many jurisdictions offer tax holidays, reduced rates, or credits contingent on maintaining employment levels, capital investment, or operational presence for specified periods. Change of control often triggers recapture provisions. In Southeast Asian markets particularly, we observe clawback exposure ranging from 15-35% of historical tax benefits received, with lookback periods of 5-10 years.
The GILTI and Subpart F Trap for US Acquirers
US acquirers of foreign targets face unique complexity under the Global Intangible Low-Taxed Income (GILTI) and Subpart F regimes. These anti-deferral provisions require current US taxation of certain foreign earnings, potentially eliminating the tax deferral benefits that made the target's low-tax structure attractive.
A US private equity firm's 2024 acquisition of a Luxembourg-based software company illustrates this challenge. The target had achieved a 9% effective tax rate through IP centralization in Luxembourg. Post-acquisition, GILTI inclusion resulted in current US taxation at 10.5% (after foreign tax credits), plus state taxes averaging 4%, bringing the total effective rate to approximately 14.5%. This 5.5 percentage point increase in the tax burden reduced projected after-tax cash flows by $8.3 million annually, decreasing the investment's IRR from 24% to 19% and reducing equity value by approximately $42 million on a present value basis.
04 Tax Shields: Validating and Preserving Value
Tax attributes—including net operating losses, tax credits, and other shields—often represent 5-15% of enterprise value in cross-border transactions. However, their realizability depends on complex limitation rules, change of ownership restrictions, and cross-border utilization constraints that require rigorous validation.
Net Operating Loss Limitations
Most jurisdictions impose limitations on NOL utilization following ownership changes. In the US, Section 382 limits annual NOL usage to the equity value of the company multiplied by the long-term tax-exempt rate (5.47% as of January 2025). For a company with $100 million in NOLs and $150 million equity value, the annual limitation would be approximately $8.2 million, extending the utilization period significantly and reducing present value.
European jurisdictions employ varied approaches: Germany allows unlimited carryforward but restricts annual utilization to 60% of taxable income above €1 million; France permits full utilization but imposes forfeiture if ownership exceeds 50% and business activity changes substantially; the UK allows carryforward but requires continuity of trade. A comprehensive NOL validation must model utilization under jurisdiction-specific rules and discount to present value using appropriate risk-adjusted rates (typically 8-12% for tax attributes).
Cross-Border Tax Credit Complexity
Foreign tax credits represent another significant but often overvalued tax attribute. US companies can credit foreign taxes paid against US tax liability on foreign-source income, but excess credits (arising when foreign rates exceed US rates) can only offset future foreign-source income and expire after 10 years. The Tax Cuts and Jobs Act's introduction of separate foreign tax credit baskets for GILTI, foreign branch income, and general category income has substantially complicated credit utilization.
In a 2025 transaction involving a US acquirer and a target with operations in 12 countries, initial projections assumed full utilization of $23 million in foreign tax credit carryforwards. Detailed modeling revealed that basket limitations, expense allocation rules, and the interaction with GILTI would permit utilization of only $14.8 million over the 10-year carryforward period, reducing the attribute's present value from $19.3 million to $11.2 million—an 8.1 million reduction in equity value.
Research and Development Credits
R&D tax credits in jurisdictions including the US, UK, France, and Canada can represent substantial value, but validation requires confirming that claimed activities meet technical definitions, documentation standards, and nexus requirements. The IRS has intensified R&D credit audits, with examination rates for credits exceeding $1 million reaching 47% in 2024. Disallowance rates in examined returns average 32%.
Due diligence should include technical review by engineers or scientists to validate that claimed activities constitute qualified research, review of contemporaneous documentation (often inadequate), and assessment of calculation methodologies. We recommend applying a 20-35% haircut to claimed R&D credits lacking robust technical documentation when modeling post-acquisition value.
05 Jurisdictional Hotspots: Where Tax Risk Concentrates
Tax risk distribution varies dramatically across jurisdictions based on regulatory complexity, enforcement intensity, and political stability. Based on 2024-2025 transaction data, several markets warrant heightened scrutiny:
India: Transfer pricing disputes, permanent establishment assertions, and indirect tax complexity (GST) create multifaceted exposure. The Indian tax authority's success rate in transfer pricing litigation exceeds 70% at initial tribunal level, though this decreases to approximately 45% on appeal. Median settlement involves payment of 55-60% of assessed amounts. Budget 2025 introduced additional documentation requirements for intercompany transactions exceeding INR 100 million.
Brazil: Notoriously complex tax system with federal, state, and municipal taxes creating overlapping obligations. ICMS (state VAT) disputes are endemic, with accumulated exposure in some transactions reaching 15-25% of enterprise value. Transfer pricing rules diverge from OECD standards, creating unique compliance challenges. Political uncertainty and aggressive enforcement make Brazil a consistent top-three risk jurisdiction.
China: Intensifying transfer pricing enforcement, particularly in technology and pharmaceutical sectors. Special Tax Adjustment rules grant authorities broad discretion to recharacterize transactions. The State Taxation Administration has prioritized cross-border tax enforcement, with audit rates for foreign-invested enterprises exceeding 35% in coastal provinces. Advance Pricing Agreement (APA) timelines have extended to 24-36 months, complicating risk mitigation strategies.
United Kingdom: Post-Brexit regulatory divergence has created compliance complexity for companies with EU and UK operations. HMRC's transfer pricing and diverted profits tax enforcement has intensified, with the 25% diverted profits tax rate creating substantial exposure for structures deemed to lack economic substance. The UK's adoption of Pillar Two minimum tax with effect from January 2024 has required structural reassessment for many groups.
In cross-border transactions involving targets with operations in these four jurisdictions, we recommend allocating 40-50% of total tax due diligence budget and time to these markets, even if they represent only 20-30% of revenue or assets.
06 The Pillar Two Impact: Recalibrating Global Tax Structures
The OECD's Pillar Two framework, implementing a 15% global minimum tax for multinational enterprises with revenues exceeding €750 million, fundamentally altered the cross-border tax landscape beginning January 1, 2024. As of March 2025, 37 jurisdictions have enacted Pillar Two legislation, with another 15 expected to implement by year-end 2025.
Pillar Two introduces top-up taxes when a multinational's effective tax rate in any jurisdiction falls below 15%, calculated on a jurisdictional basis using a complex income inclusion rule (IIR) and undertaxed profits rule (UTPR). The framework's complexity—spanning over 70 pages of model rules and 200+ pages of administrative guidance—creates significant compliance burden and planning uncertainty.
Due Diligence Implications
For transactions involving in-scope multinationals, Pillar Two due diligence must assess:
- Current effective tax rate by jurisdiction: Detailed modeling using Pillar Two calculation methodology (which differs from book tax rates) to identify jurisdictions subject to top-up tax
- Structural optimization opportunities: Evaluation of whether historical low-tax structures remain viable or require reconfiguration
- Compliance infrastructure: Assessment of systems and processes needed to perform complex jurisdictional calculations, maintain required documentation, and file new returns
- Cash tax impact: Quantification of incremental cash tax burden from top-up taxes, typically ranging from 1-4% of EBITDA for companies with significant low-tax operations
A 2024 acquisition of a technology company with centralized IP in Ireland (12.5% statutory rate, 8% effective rate after incentives) illustrates the impact. Pillar Two modeling revealed €18 million in annual top-up tax liability, reducing projected after-tax cash flows by 11% and decreasing equity value by approximately €95 million (7.3% of purchase price). The acquirer negotiated a €72 million purchase price reduction and implemented structural changes to minimize ongoing top-up tax exposure.
07 Structuring Considerations: Tax-Efficient Acquisition Architecture
Tax due diligence findings should directly inform acquisition structure decisions. The interplay between target tax attributes, acquirer tax profile, financing strategy, and post-closing integration plans creates a multidimensional optimization problem.
Asset vs. Stock Transactions
In cross-border contexts, the asset vs. stock decision involves additional complexity beyond domestic considerations. Asset acquisitions typically provide step-up in tax basis (generating future depreciation and amortization deductions) but may trigger significant transaction taxes including VAT, stamp duties, and capital gains at the target level. Stock acquisitions preserve target tax attributes but provide no basis step-up.
The calculus varies by jurisdiction: in the US, Section 338(g) elections permit stock acquisitions to be treated as asset acquisitions for tax purposes, though this triggers corporate-level tax. Germany's Section 1 UmwStG permits tax-neutral asset transfers in qualifying reorganizations. The UK's substantial shareholding exemption can eliminate capital gains tax on stock sales meeting specific conditions.
Sophisticated modeling comparing after-tax cash flows under alternative structures typically reveals value differences of 8-15% of purchase price, making structure optimization a critical value driver. Tools like iValuate enable rapid scenario analysis across multiple jurisdictional and structural permutations, allowing dealmakers to identify optimal configurations efficiently.
Acquisition Financing and Interest Deductibility
Cross-border acquisition financing structures must navigate increasingly restrictive interest deduction limitations. BEPS Action 4 recommendations, implemented across most OECD countries, typically limit interest deductions to 30% of EBITDA (with variations: 25% in Netherlands, 30% in Germany and France, 10-30% in various Asian jurisdictions).
These limitations make traditional leveraged buyout structures less tax-efficient and require careful modeling of interest utilization capacity. In a €450 million European LBO we advised on in 2024, interest limitation rules reduced the present value of interest deductions by €38 million compared to pre-BEPS expectations, requiring structural modifications including equity co-investment from the target's operating subsidiaries and hybrid financing instruments.
08 Post-Closing Integration: Preserving Tax Efficiency
Tax due diligence must extend beyond identifying historical exposures to planning post-closing integration that preserves tax efficiency and attributes. Common integration missteps that destroy tax value include:
- Premature legal entity consolidation: Merging entities before fully utilizing NOLs or credits subject to separate return limitations
- Intercompany restructuring without transfer pricing analysis: Reallocating functions, assets, or risks without documenting arm's length compensation, creating new transfer pricing exposure
- Intellectual property migration: Moving IP to achieve operational efficiency without considering tax consequences and documentation requirements
- Financing restructuring: Modifying intercompany debt without analyzing withholding tax, thin capitalization, and interest deduction implications
A 100-day post-closing tax integration roadmap should address entity structure optimization, intercompany agreement documentation, transfer pricing policy alignment, and tax attribute preservation strategies. Companies that execute structured tax integration realize 15-25% more value from tax attributes compared to those that approach integration reactively.
09 Risk Mitigation Strategies and Deal Protection
Even comprehensive tax due diligence cannot eliminate all uncertainty. Sophisticated transactions employ multiple risk mitigation mechanisms:
Representations, Warranties, and Indemnities
Purchase agreements should include specific tax representations covering filing compliance, payment history, audit outcomes, and absence of known disputes. Tax indemnities typically provide dollar-for-dollar protection for pre-closing tax liabilities, with survival periods matching applicable statutes of limitations (commonly 3-7 years depending on jurisdiction).
Indemnity caps for tax matters often exceed general indemnity caps, ranging from 30-50% of purchase price for material tax risk compared to 10-25% for general matters. Baskets (deductibles) for tax claims typically range from 0.5-1.5% of purchase price, lower than general baskets of 1-3%.
Representation and Warranty Insurance
Tax-specific R&W insurance has become standard in transactions exceeding $100 million, with 73% of deals in this range including tax coverage in 2024. Premiums typically range from 3-6% of coverage limits, with retention (deductible) of 0.75-1.5% of enterprise value.
Tax R&W insurance provides several advantages: extended coverage periods (up to 7 years for tax vs. 3-4 years for general matters), higher limits (up to 25-30% of purchase price), and cleaner exits for sellers. However, insurers exclude known risks, require extensive underwriting due diligence, and impose sub-limits for specific exposures like transfer pricing (typically 50-75% of overall tax limit).
Escrows and Holdbacks
For transactions with identified tax exposures pending resolution, escrows provide security without requiring immediate purchase price adjustment. Typical tax escrows range from 100-150% of estimated exposure to cover potential penalties and interest, with release provisions tied to statute expiration or dispute resolution.
In a 2025 transaction involving a target with ongoing transfer pricing audits in three jurisdictions, the parties established a $28 million escrow (representing 125% of estimated exposure) with staged release: 40% upon resolution of the first audit, 30% upon resolution of the second, and 30% upon statute expiration in the third jurisdiction or earlier resolution.
10 The Path Forward: Tax Due Diligence as Value Creation
As cross-border M&A activity continues its upward trajectory through 2025 and into 2026—with full-year 2025 volume projected to reach $1.8 trillion, a 19% increase over 2024—the sophistication of tax due diligence must evolve commensurately. The convergence of Pillar Two implementation, intensifying transfer pricing enforcement, and digital economy taxation creates a risk landscape materially different from even three years ago.
Leading acquirers increasingly view tax due diligence not merely as risk identification but as value creation opportunity. Comprehensive tax analysis informs structure optimization, identifies integration synergies, and enables proactive risk mitigation that preserves equity value. The differential between sophisticated and superficial tax due diligence approaches typically ranges from 5-12% of equity value—representing $12-30 million in a $250 million transaction.
The technical complexity and jurisdictional breadth of modern cross-border tax due diligence requires specialized expertise and analytical tools capable of modeling multiple scenarios across varied regulatory frameworks. Professional platforms like iValuate enable advisors and corporate development teams to perform rigorous tax impact analysis, scenario modeling, and risk quantification efficiently, ensuring that tax considerations receive appropriate weight in valuation and deal structuring decisions.
In an environment where tax authorities globally have enhanced enforcement capabilities, expanded information sharing through automatic exchange frameworks, and adopted increasingly aggressive positions on cross-border structures, the cost of inadequate tax due diligence has never been higher. For dealmakers navigating the complexities of international M&A, comprehensive tax analysis represents not an optional enhancement but an essential foundation for value preservation and creation.