Table of Contents15 sections
Enterprise Value to EBITDA (EV/EBITDA) remains the most widely used valuation multiple in corporate finance, M&A, and private equity transactions. As we progress through 2025 and look toward 2026, understanding current sector-specific multiples has become increasingly critical as market conditions continue to evolve following the interest rate normalization cycle and shifting macroeconomic fundamentals.
This comprehensive analysis examines median EV/EBITDA trading multiples across more than 20 distinct sectors, providing the technical context and market intelligence that valuation professionals require for defensible comparable company analyses and transaction pricing.
01 Understanding EV/EBITDA in the Current Market Context
The EV/EBITDA multiple measures enterprise value—the total value of a company's equity plus net debt—relative to its earnings before interest, taxes, depreciation, and amortization. This capital structure-neutral metric enables direct comparison across companies with different financing structures, making it superior to price-to-earnings ratios for many valuation applications.
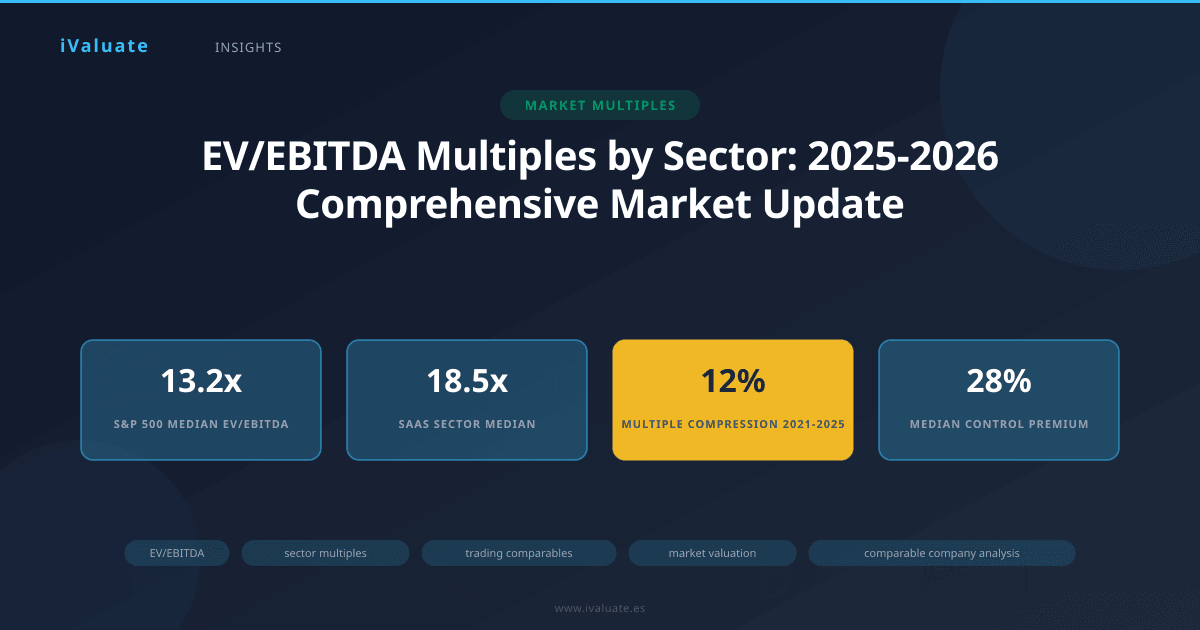
As of Q1 2025, the median EV/EBITDA multiple across the S&P 500 stands at 13.2x, representing a 180 basis point compression from the 15.0x peak observed in late 2021. This normalization reflects several concurrent factors: the Federal Reserve's terminal rate reaching 4.50% before recent cuts to 4.25%, inflation moderating to the 2.5-3.0% range, and corporate earnings growth decelerating to mid-single digits after the post-pandemic surge.
The current multiple environment represents a return to historical norms rather than distress. The 10-year median EV/EBITDA for the S&P 500 is 12.8x, suggesting current valuations are only modestly elevated relative to long-term trends.
02 Technology and Software: Bifurcation Continues
The technology sector exhibits the widest valuation dispersion of any major industry group, with median multiples ranging from 8.5x for legacy IT services firms to 22.5x for high-growth SaaS companies with strong unit economics.
Enterprise Software and SaaS
Enterprise software companies with recurring revenue models command a median EV/EBITDA of 18.5x as of March 2025, down from 28.0x in 2021 but stabilizing after the 2022-2023 correction. Companies demonstrating net revenue retention above 110% and Rule of 40 compliance (revenue growth rate plus EBITDA margin exceeding 40%) trade at a premium, with top-quartile multiples reaching 25.0x to 30.0x.
The market has become increasingly discriminating, with growth-at-all-costs models no longer commanding premium valuations. Profitability and cash generation now matter significantly. Software companies with EBITDA margins below 20% trade at a 35-40% discount to those with margins exceeding 30%, even when controlling for growth rates.
Semiconductors and Hardware
Semiconductor manufacturers trade at a median 14.2x EV/EBITDA, reflecting cyclical concerns despite strong AI-driven demand. This represents a premium to the historical 10-year median of 11.5x, driven primarily by companies exposed to artificial intelligence infrastructure, which command multiples of 20.0x or higher. Traditional commodity chip manufacturers trade closer to 9.0x to 11.0x.
IT Services and Consulting
The IT services sector shows median multiples of 11.5x, with limited variance between top and bottom quartiles (9.5x to 13.5x). This sector's mature, competitive dynamics and labor-intensive business models result in compressed multiples relative to product-based technology companies.
03 Healthcare: Subsector Divergence Reflects Innovation Premium
Healthcare demonstrates significant subsector variation, with multiples ranging from 8.0x for mature pharmaceutical distributors to 25.0x+ for innovative biotechnology firms with late-stage pipelines.
Biotechnology and Pharmaceuticals
Established pharmaceutical companies with diversified portfolios trade at a median 12.8x EV/EBITDA, while biotechnology firms with commercial-stage products command 16.5x. The premium reflects growth expectations and pipeline value, though it has compressed from the 22.0x median observed in 2020-2021 when capital was abundant and risk appetite was elevated.
Companies with products addressing large unmet medical needs in oncology, rare diseases, and metabolic disorders continue to command premium valuations, often trading at 20.0x or higher when demonstrating clear paths to blockbuster status (>$1 billion annual revenue).
Medical Devices and Equipment
Medical device manufacturers trade at 15.5x median EV/EBITDA, supported by recurring revenue from consumables, strong regulatory moats, and favorable demographic trends. Companies with significant exposure to elective procedures experienced multiple compression during 2023-2024 as procedure volumes normalized post-pandemic, but have since stabilized.
Healthcare Services and Managed Care
Healthcare services companies, including hospital operators and managed care organizations, trade at more modest 9.5x to 11.0x multiples, reflecting regulatory risk, reimbursement pressure, and lower margins. However, companies successfully implementing value-based care models and demonstrating margin expansion trade at premiums of 15-25% to sector medians.
04 Financial Services: Rate Sensitivity Drives Dispersion
The financial services sector has experienced significant multiple re-rating as interest rates normalized from near-zero levels.
Banks and Diversified Financials
Regional banks trade at a median 8.5x EV/EBITDA as of early 2025, recovering from the 7.2x trough following the March 2023 banking stress but still below the 10.0x pre-pandemic median. Concerns about commercial real estate exposure, deposit costs, and net interest margin compression continue to weigh on valuations.
Money center banks with diversified revenue streams trade at a premium 10.5x median, supported by stronger capital positions, fee-based revenue, and trading operations. Banks demonstrating deposit franchise strength and maintaining cost of deposits below 2.0% command top-quartile multiples of 11.5x to 12.5x.
Asset Management and Private Equity
Asset managers trade at 12.0x median EV/EBITDA, with significant dispersion based on fee rates, AUM growth, and product mix. Alternative asset managers with permanent capital vehicles and performance fees trade at substantial premiums, often 16.0x to 20.0x, while traditional active equity managers face multiple compression, trading closer to 8.0x to 9.0x.
Insurance
Property & casualty insurers trade at 9.8x median EV/EBITDA, while life insurance and reinsurance companies trade at 8.5x to 9.0x. The sector faces headwinds from catastrophic weather events and reserve adequacy concerns, but benefits from improved investment income as rates have risen.
05 Consumer Sectors: Discretionary vs. Staples Spread Widens
Consumer Discretionary
Consumer discretionary companies show a median 11.5x EV/EBITDA, with luxury goods manufacturers commanding significant premiums at 18.0x to 22.0x based on brand strength, pricing power, and exposure to resilient high-net-worth consumers. Automotive retailers and traditional department stores trade at the low end, 6.0x to 8.0x, facing structural headwinds from e-commerce and changing consumer preferences.
Restaurant chains demonstrate interesting bifurcation: quick-service restaurants with strong unit economics and franchising models trade at 13.0x to 15.0x, while casual dining concepts trade at 8.0x to 10.0x. Digital ordering capabilities and delivery integration have become key valuation drivers, with companies generating >30% of sales through digital channels commanding 20-25% premiums.
Consumer Staples
Consumer staples companies trade at 13.5x median EV/EBITDA, a premium to discretionary reflecting defensive characteristics and stable cash flows. However, this represents compression from the 15.5x median in 2020-2021 when defensive sectors commanded elevated premiums during pandemic uncertainty.
Branded food and beverage companies with pricing power trade at 14.5x to 16.0x, while private label-exposed companies and commodity processors trade at 9.0x to 11.0x. The ability to pass through inflation without volume loss has become a critical valuation differentiator.
06 Industrial and Manufacturing: Cyclical Recovery Underway
Industrial companies trade at a median 12.0x EV/EBITDA, reflecting moderate economic growth expectations and normalization from supply chain disruptions.
Aerospace and Defense
Aerospace and defense contractors command 14.5x median multiples, supported by strong order backlogs, multi-year contracts, and geopolitical tensions driving defense spending. Commercial aerospace suppliers trade at premiums of 16.0x to 18.0x as aircraft production rates increase and aftermarket activity remains robust.
Industrial Machinery and Equipment
Machinery manufacturers trade at 11.5x median EV/EBITDA, with companies exposed to automation, electrification, and energy transition themes commanding premiums. Traditional cyclical machinery businesses trade closer to 9.0x to 10.0x, reflecting concerns about capital spending cycles and global manufacturing activity.
Construction and Engineering
Construction and engineering firms trade at modest 8.5x to 10.0x multiples, reflecting project-based revenue models, execution risk, and working capital intensity. However, companies with strong infrastructure backlogs supported by government spending programs trade at the higher end of this range.
07 Energy and Utilities: Transition Themes Emerge
Oil and Gas
Integrated oil and gas companies trade at 6.5x median EV/EBITDA, while exploration and production companies trade at 5.0x to 5.5x, reflecting commodity price volatility and energy transition concerns. However, companies demonstrating capital discipline, strong free cash flow generation, and shareholder returns through dividends and buybacks have seen multiple expansion, with top performers trading at 8.0x to 9.0x.
Renewable Energy and Utilities
Renewable energy developers and operators trade at 11.0x to 13.0x EV/EBITDA, supported by contracted revenue streams and growth visibility. Traditional regulated utilities trade at 10.0x to 11.0x, offering stable, predictable cash flows but limited growth. Companies successfully transitioning portfolios toward renewables while maintaining regulatory relationships command premium valuations.
08 Real Estate and REITs: Rate Normalization Impact
Real estate operating companies trade at 11.5x median EV/EBITDA, though REIT valuation typically focuses on price-to-FFO and NAV metrics. Industrial and data center REITs trade at significant premiums, 15.0x to 18.0x, driven by e-commerce and cloud computing demand. Office REITs face headwinds, trading at 7.0x to 9.0x as remote work impacts demand fundamentals.
09 Telecommunications and Media: Convergence Continues
Telecommunications providers trade at 7.5x to 8.5x EV/EBITDA, reflecting mature markets, high capital intensity, and competitive pressure. Media and entertainment companies show wider dispersion, 9.0x to 14.0x, with streaming-focused companies trading at premiums when demonstrating subscriber growth and improving unit economics.
10 Emerging Sectors: Climate Tech and Digital Infrastructure
Climate technology companies, including carbon capture, battery technology, and sustainable materials, trade at wide-ranging multiples from 12.0x to 25.0x+ based on commercial maturity and growth visibility. Digital infrastructure, including data centers and cell towers, commands premium 16.0x to 19.0x multiples supported by long-term contracts and critical infrastructure characteristics.
11 Historical Context: Multiple Compression and Recovery
Examining the 2020-2025 period provides essential context for current valuations. The median EV/EBITDA across major indices peaked in late 2021:
- S&P 500: 15.0x peak (Q4 2021) vs. 13.2x current (Q1 2025)
- Russell 2000: 12.5x peak vs. 10.8x current
- MSCI World: 14.2x peak vs. 12.5x current
The 2022-2023 correction was driven primarily by multiple compression rather than earnings deterioration. S&P 500 earnings grew approximately 12% from 2021 to 2024, while valuations compressed 12%, resulting in flat index performance during this period.
The current environment represents normalization rather than distress. Credit spreads remain relatively tight, with high-yield spreads at approximately 350 basis points above Treasuries, well below distressed levels of 800+ basis points. M&A activity has recovered, with 2024 global deal volume reaching $3.2 trillion, up 15% year-over-year, suggesting healthy risk appetite and financing availability.
12 Practical Application: Using Sector Multiples in Valuation
When applying sector multiples in valuation work, several technical considerations are essential:
Peer Selection Criteria: Identify truly comparable companies based on size (typically within 0.5x to 2.0x revenue), growth profile (±500 basis points), profitability (±300 basis points EBITDA margin), and business model. A common error is including companies that appear similar but have fundamentally different economics.
Adjustments for Comparability: Normalize EBITDA for non-recurring items, adjust for differences in lease accounting (particularly post-ASC 842), and consider stock-based compensation treatment. For technology companies, adding back SBC to EBITDA can change multiples by 15-25%.
Size Premiums and Discounts: Smaller companies typically trade at 20-40% discounts to large-cap peers within the same sector, reflecting liquidity, access to capital, and business risk. This size effect is most pronounced in the $50-500 million enterprise value range.
Control Premiums: Public trading multiples reflect minority interests. Control transactions typically occur at 25-35% premiums to trading prices, though this varies significantly by sector and market conditions. In the current environment, median control premiums have compressed to approximately 28% from 35%+ in 2020-2021.
13 Case Study Applications
Case 1: Mid-Market SaaS Company Valuation
A $150 million revenue SaaS company with 25% revenue growth, 15% EBITDA margins, and 105% net revenue retention sought valuation for a potential sale in Q4 2024. Using public comparables trading at 18.5x median EV/EBITDA, we applied a 25% size discount (13.9x) and a 10% discount for below-median profitability (12.5x). With normalized EBITDA of $22.5 million, this suggested an enterprise value of $281 million. The company ultimately sold for $295 million (13.1x), validating the methodology while reflecting buyer-specific synergies.
Case 2: Industrial Distribution Business
A $75 million EBITDA industrial distributor with flat growth and 8% margins was valued using industrial distribution comparables trading at 9.5x median. After applying a 30% size discount (6.7x) but adding back a 15% premium for superior working capital management and customer diversification (7.7x), the indicated enterprise value was $578 million. This case illustrates how company-specific factors can offset size discounts.
Case 3: Healthcare Services Platform
A healthcare services platform with $40 million EBITDA, 15% organic growth, and value-based care contracts was valued using healthcare services comparables at 11.0x median. The company's superior growth and innovative care model justified a 35% premium (14.9x), while size considerations suggested a 20% discount (11.9x), resulting in a net 8% premium (11.9x) and enterprise value of $476 million.
14 Looking Forward: 2025-2026 Multiple Outlook
Several factors will influence sector multiples through 2026:
Interest Rate Environment: With the Federal Reserve expected to maintain rates in the 3.75-4.25% range through 2025 before potential further cuts in 2026, the discount rate environment should remain relatively stable. Each 25 basis point rate cut historically correlates with 3-5% multiple expansion, all else equal.
Earnings Growth Expectations: Consensus estimates project S&P 500 earnings growth of 8-10% in 2025 and 7-9% in 2026, supporting current multiples. However, any significant deviation could drive multiple re-rating, particularly in growth-sensitive sectors like technology and consumer discretionary.
M&A and Private Equity Activity: With approximately $2.8 trillion in private equity dry powder globally and strategic acquirers holding strong balance sheets, transaction activity should remain robust, supporting multiples through demonstrated pricing. However, financing costs remain elevated relative to 2020-2021, potentially limiting leverage and transaction multiples.
Sector-Specific Catalysts: AI adoption will likely continue supporting technology multiples, energy transition themes should benefit renewables and climate tech, and healthcare innovation in GLP-1 drugs and cell therapy may drive biotech premiums. Conversely, commercial real estate concerns may pressure related sectors.
15 Conclusion: Navigating the Multiple Landscape
The current EV/EBITDA multiple environment reflects a market that has normalized from pandemic-era extremes while maintaining reasonable valuations relative to historical standards. Sector multiples in 2025 show rational differentiation based on growth, profitability, and structural trends rather than the indiscriminate compression or expansion seen in prior cycles.
For valuation professionals, the key is understanding not just the median multiple but the drivers of dispersion within sectors. A technology company is not simply worth 15x EBITDA—its multiple depends on growth trajectory, profitability, business model, competitive position, and dozens of other factors. Similarly, a healthcare company's 12x multiple may be appropriate or significantly mispriced depending on pipeline value, regulatory risk, and reimbursement dynamics.
The technical rigor required for defensible valuation work demands comprehensive comparable company analysis, thoughtful adjustments, and clear documentation of methodology. Professional tools like iValuate enable practitioners to efficiently access current market data, perform sophisticated comparable company analyses, and generate institutional-quality valuation reports that withstand scrutiny from investors, lenders, and regulatory bodies.
As we progress through 2025 and into 2026, maintaining current knowledge of sector-specific multiples and their drivers will remain essential for accurate valuation, successful transaction execution, and sound capital allocation decisions. The market continues to reward companies demonstrating sustainable competitive advantages, strong unit economics, and clear paths to value creation—characteristics that transcend any single multiple or valuation metric.