Table of Contents7 sections
The energy sector stands at an unprecedented inflection point. As of early 2026, global energy markets reflect a complex duality: traditional hydrocarbon producers continue generating substantial cash flows while renewable energy assets command premium valuations based on fundamentally different economic drivers. For valuation professionals, this transition era demands fluency in two distinct analytical frameworks and the judgment to integrate them appropriately.
The challenge extends beyond simply applying different methodologies to different asset classes. Energy companies increasingly operate hybrid portfolios—a major oil producer may own solar farms, battery storage facilities, and carbon capture projects alongside conventional reserves. Private equity funds deploy capital across the spectrum, from Permian Basin acreage to offshore wind developments. This convergence requires valuation approaches that acknowledge both the enduring economics of hydrocarbon production and the growth dynamics of renewable infrastructure.
01 The Traditional Energy Valuation Framework
Traditional energy company valuation remains anchored in reserve-based analysis, despite ongoing portfolio diversification. The fundamental premise—that a company's value derives primarily from its ability to extract and monetize hydrocarbon reserves—continues to drive valuation for pure-play producers and the conventional segments of integrated companies.
Reserve-Based Lending and PV-10 Metrics
Reserve-based lending (RBL) facilities remain the dominant financing structure for upstream oil and gas companies, with borrowing bases determined by the present value of proven developed producing (PDP) reserves. As of 2025-2026, banks typically advance 60-70% of PV-9 (present value discounted at 9%) for PDP reserves, with lower advance rates for proved developed non-producing (PDNP) and proved undeveloped (PUD) reserves.
The PV-10 calculation—discounting future net revenues from proved reserves at 10%—serves as the industry standard valuation metric, required in SEC filings and universally understood by energy lenders and investors. The methodology applies projected production profiles to current strip pricing (or management price decks), subtracts operating costs and capital expenditures, and discounts the resulting cash flows at a flat 10% rate.
In the current environment, PV-10 valuations face heightened scrutiny on three dimensions:
- Price deck assumptions: With WTI crude trading in the $70-85 range through early 2026 and natural gas prices exhibiting extreme volatility ($2-6/MMBtu), the selection of forward price curves dramatically impacts valuations. Conservative lenders increasingly require sensitivity analyses showing reserve values across multiple price scenarios.
- Operating cost inflation: Oilfield services costs increased 15-20% between 2023-2025, compressing margins for marginal wells. PV-10 calculations must reflect realistic lease operating expenses (LOE), which now average $15-25/boe for conventional production and $8-12/boe for unconventional plays.
- Regulatory and ESG considerations: Abandonment liabilities, methane regulations, and carbon pricing expectations affect net cash flows. Leading practitioners now incorporate estimated carbon costs of $30-60/ton in long-term projections, reducing PV-10 values by 5-15% depending on asset carbon intensity.
A practical example illustrates these dynamics: A Permian Basin pure-play producer with 150 million boe of proved reserves might show a PV-10 of $2.8 billion using current strip pricing and $12/boe operating costs. However, applying a conservative flat $65 WTI price deck and incorporating $40/ton carbon costs reduces the PV-10 to $2.1 billion—a 25% variance that directly impacts borrowing capacity and M&A valuations.
Enterprise Value Multiples and Peer Comparisons
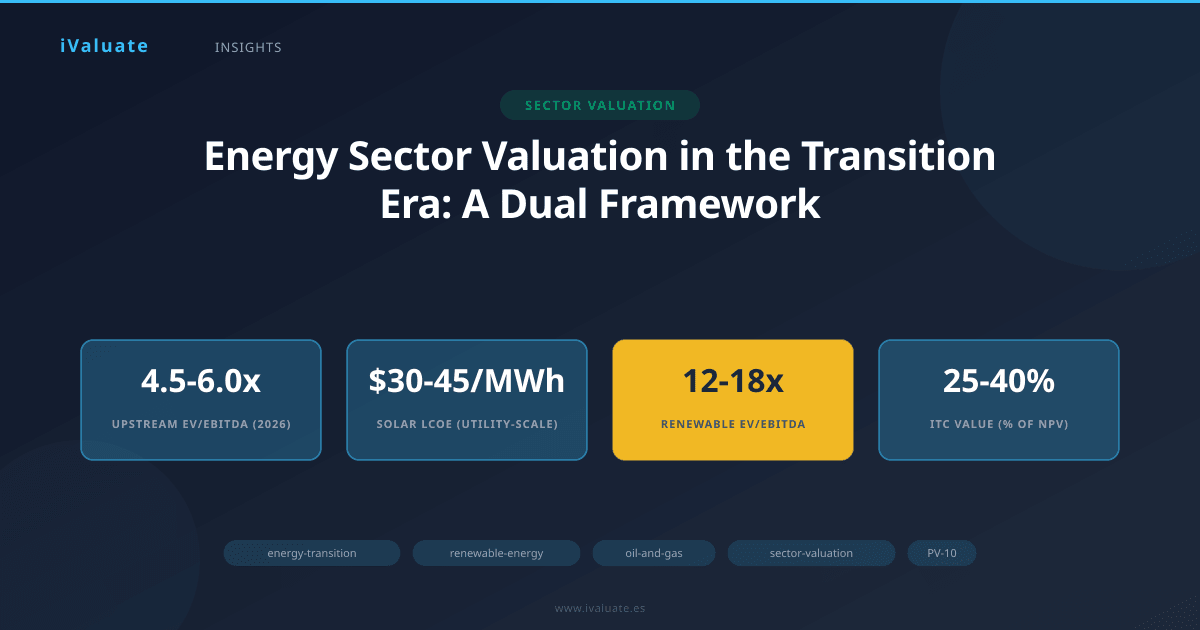
Traditional energy companies trade at enterprise value multiples that reflect both current cash generation and market sentiment regarding long-term demand. As of Q1 2026, upstream pure-plays trade at median EV/EBITDA multiples of 4.5-6.0x, significantly below the broader market average of 12-14x. This persistent discount reflects terminal value concerns and capital allocation skepticism.
More revealing are asset-specific metrics: EV per flowing barrel (EV/boe/d) and EV per proved reserve (EV/boe). Tier-1 Permian assets command $60,000-80,000 per flowing barrel, while conventional Gulf Coast production trades at $30,000-45,000 per flowing barrel. On a reserve basis, premium unconventional assets trade at $12-18/boe, compared to $6-10/boe for conventional reserves with higher decline rates.
The valuation gap between high-quality, low-decline assets and marginal production has widened substantially. Investors increasingly differentiate based on:
- Breakeven economics (sub-$40 WTI breakevens command 40-60% premiums)
- Inventory depth (10+ years of drilling locations support premium valuations)
- ESG metrics (low methane intensity and strong governance reduce cost of capital)
- Free cash flow generation (companies returning >50% of cash flow to shareholders trade at premium multiples)
02 Renewable Energy Asset Valuation
Renewable energy assets require fundamentally different valuation approaches, reflecting their characteristics as long-duration infrastructure investments with contracted or quasi-contracted revenue streams. The absence of commodity price exposure (for wind and solar) and the presence of government incentives create valuation dynamics more akin to regulated utilities than commodity producers.
Levelized Cost of Energy (LCOE) as a Competitive Benchmark
The levelized cost of energy represents the per-unit cost ($/MWh) of building and operating a generating asset over its lifetime, incorporating all capital expenditures, operating costs, financing costs, and assumed utilization rates. LCOE serves as the fundamental competitive benchmark—projects with LCOE below prevailing power prices generate positive returns.
As of 2026, unsubsidized LCOE for utility-scale renewables has reached historic lows:
- Utility-scale solar PV: $30-45/MWh for projects in favorable locations with strong irradiance
- Onshore wind: $25-50/MWh depending on wind resource quality and transmission access
- Offshore wind: $65-95/MWh, declining as installation techniques improve and turbine sizes increase
- Battery storage (4-hour): $140-180/MWh on a standalone basis, but increasingly bundled with solar to provide dispatchable capacity
These LCOE figures compare favorably to combined-cycle natural gas plants ($45-75/MWh depending on gas prices) and dramatically undercut coal generation ($65-120/MWh). The economic competitiveness drives deployment independent of policy support, though tax incentives remain significant value drivers.
Discounted Cash Flow and Contracted Revenue Models
Renewable energy project valuation typically employs detailed DCF models incorporating:
Revenue modeling: Projects with power purchase agreements (PPAs) feature contracted revenues, often with 15-25 year terms and inflation escalators. Merchant projects require detailed power price forecasting, incorporating renewable penetration impacts, storage deployment, and regional supply-demand dynamics. As of 2026, merchant solar projects in ERCOT face substantial basis risk, with nodal pricing varying by $15-30/MWh depending on transmission congestion.
Production profiles: Wind and solar assets experience degradation over time—solar panels typically degrade 0.5-0.7% annually, while wind turbines face both performance degradation and increased maintenance requirements after 10-15 years. Conservative models incorporate these factors explicitly.
Tax incentives: The Inflation Reduction Act's production tax credits (PTC) and investment tax credits (ITC) remain substantial value drivers. Projects placed in service through 2032 qualify for PTCs of $27.50/MWh (inflation-adjusted) for wind and $15/MWh for solar, or ITCs of 30-50% of capital costs depending on domestic content and energy community provisions. These incentives typically represent 25-40% of project NPV.
Discount rates: Renewable projects with contracted revenues typically warrant discount rates of 6-9%, reflecting their infrastructure-like risk profile. Merchant projects require 9-12% discount rates to reflect power price and basis risk. The discount rate selection profoundly impacts valuation—a 200 basis point difference in WACC changes project NPV by 15-25%.
Consider a 200 MW solar project in Texas with a 15-year PPA at $42/MWh, $220 million capital cost, and 25% capacity factor. With ITC benefits and 7.5% discount rate, the project generates an NPV of approximately $65 million (equity IRR of 14-16%). The same project on a merchant basis, assuming $38/MWh average realized prices and 10% discount rate, produces NPV of $25-30 million (equity IRR of 9-11%).
03 Valuing Hybrid Energy Companies
The most complex valuation challenges arise with companies operating across the energy spectrum. Major integrated energy companies now report renewable energy segments alongside upstream, downstream, and midstream operations. Independent power producers blend natural gas generation with wind and solar portfolios. Private equity-backed platforms acquire both conventional and renewable assets opportunistically.
Sum-of-the-Parts Methodology
Hybrid energy companies typically require sum-of-the-parts (SOTP) valuation, applying appropriate methodologies to each business segment. A representative integrated energy company might be valued as:
- Upstream conventional: PV-10 methodology with 0.8-1.2x multiple depending on asset quality and inventory depth
- Renewable generation: DCF of contracted and merchant projects with 8-12x EBITDA multiple for operating assets
- Midstream/infrastructure: DCF of fee-based cash flows with 10-14x EBITDA multiple
- Corporate overhead: Capitalized at 6-8x annual costs as a valuation reduction
The critical judgment involves determining appropriate multiples for renewable segments. As of 2026, pure-play renewable energy companies trade at EV/EBITDA multiples of 12-18x, substantially above traditional energy multiples. However, renewable segments within integrated energy companies often trade at discounts of 20-30% to pure-play comparables, reflecting:
- Conglomerate discounts and lack of strategic focus
- Investor skepticism regarding management commitment to energy transition
- Capital allocation concerns (will cash from conventional assets fund renewable growth?)
- Different investor bases (traditional energy investors vs. ESG-focused funds)
Transition Risk and Stranded Asset Considerations
Energy transition risk represents the most significant valuation wildcard. The risk that conventional energy assets become economically unviable before their technical life expires—due to policy changes, technological disruption, or demand destruction—requires explicit consideration in terminal value assumptions.
Leading valuation practices now incorporate transition scenarios:
Base case: Gradual energy transition consistent with 2.5-3.0°C warming pathway, with oil demand plateauing in the 2030s and natural gas demand remaining robust through 2040s. Conventional assets retain value but face compressed multiples.
Accelerated transition: Policy-driven rapid decarbonization consistent with 1.5-2.0°C pathways, with oil demand peaking before 2030 and coal phase-out by 2035. High-cost, high-carbon assets face material impairment risk.
Delayed transition: Slower policy implementation and continued fossil fuel demand growth, particularly in developing markets. Conventional assets retain value longer but face eventual cliff-edge risk.
Probability-weighting these scenarios produces blended valuations that explicitly capture transition uncertainty. A conventional oil producer might show $45/share value in the base case, $32/share in accelerated transition, and $58/share in delayed transition. Applying 50%/30%/20% probabilities yields a probability-weighted value of $44/share—materially below the base case and reflecting asymmetric downside risk.
04 Real-World Application: Three Case Studies
Case Study 1: Permian Pure-Play Valuation
A private equity fund evaluated a Permian Basin pure-play producer with 85,000 boe/d production (70% oil), 450 million boe proved reserves, and 8 years of drilling inventory. The company generated $850 million EBITDA at $75 WTI pricing. Traditional metrics suggested:
- PV-10 of $4.2 billion (using SEC pricing)
- EV/EBITDA of 5.2x at $4.4 billion enterprise value
- EV per flowing barrel of $52,000
However, detailed analysis revealed 25% of reserves had breakevens above $55 WTI, creating significant tail risk. Incorporating carbon costs and applying transition scenario analysis reduced the fair value range to $3.8-4.1 billion. The fund ultimately passed, citing insufficient margin of safety given transition risks and the seller's $4.5 billion asking price.
Case Study 2: Renewable Platform Valuation
An independent power producer operated 2.5 GW of renewable capacity (60% wind, 40% solar) with 75% of output under long-term PPAs averaging $45/MWh. The portfolio generated $285 million EBITDA with minimal maintenance capex requirements. Comparable pure-play renewable companies traded at 15-17x EBITDA, suggesting $4.3-4.8 billion valuation.
However, the company's PPAs had weighted average remaining life of only 8 years, creating significant re-contracting risk. Detailed DCF analysis incorporating merchant tail assumptions and 8% discount rate produced NPV of $3.9 billion. The company ultimately sold for $4.1 billion (14.4x EBITDA), reflecting a modest premium to DCF but discount to pure-play multiples.
Case Study 3: Integrated Energy Major
A European integrated energy company operated upstream oil and gas assets (60% of EBITDA), renewable generation (25% of EBITDA), and retail energy supply (15% of EBITDA). Sum-of-the-parts analysis valued:
- Upstream: $18 billion (5.5x segment EBITDA, 0.9x PV-10)
- Renewables: $9 billion (13x segment EBITDA, 30% discount to pure-plays)
- Retail: $3 billion (6x segment EBITDA)
- Corporate/other: ($2 billion)
SOTP value of $28 billion compared to market capitalization of $24 billion, suggesting 15% undervaluation. However, the discount reflected investor concerns about capital allocation—the company had historically prioritized dividend maintenance over renewable investment, creating credibility issues regarding its transition strategy.
05 Practical Considerations for Valuation Professionals
Energy sector valuation in the transition era requires several practical adaptations:
Scenario analysis is mandatory: Single-point valuations inadequately capture the range of potential outcomes. Develop explicit base, upside, and downside cases with clearly articulated assumptions about energy prices, policy evolution, and technology costs.
Discount rate selection requires careful judgment: The appropriate WACC for energy assets varies dramatically based on business model, contract structure, and commodity exposure. Conventional upstream assets typically warrant 10-12% discount rates, while contracted renewable projects may justify 6-8% rates. Blended portfolios require segment-specific WACCs.
Terminal value assumptions drive outcomes: For conventional assets, terminal value assumptions must reflect realistic production decline rates and potential demand destruction. Perpetuity growth assumptions above 0-1% rarely make sense for hydrocarbon producers. For renewable assets, terminal values should reflect asset life limitations and re-contracting risk.
Tax considerations are increasingly complex: Renewable energy tax credits, carbon pricing mechanisms, and potential changes to hydrocarbon taxation create significant valuation impacts. Model tax explicitly rather than using simplified effective tax rate assumptions.
ESG metrics affect cost of capital: Companies with strong ESG performance demonstrably access capital at lower costs. Incorporate ESG considerations into discount rate selection—high-emitting assets without credible transition plans may warrant 100-200 basis points of additional risk premium.
06 The Role of Technology in Modern Energy Valuation
The complexity of modern energy valuation—integrating reserve engineering, power market modeling, tax incentive optimization, and transition scenario analysis—increasingly requires sophisticated analytical tools. Valuation professionals benefit from platforms that can:
- Maintain detailed reserve databases with decline curve analysis
- Model complex renewable energy cash flows with hourly production profiles
- Incorporate tax incentive optimization across multiple jurisdictions
- Generate scenario analyses with probability-weighted outcomes
- Benchmark against comprehensive transaction and trading multiples databases
While spreadsheet-based approaches remain common, they struggle to handle the dimensionality of modern energy valuation. Leading practitioners increasingly adopt purpose-built valuation platforms that integrate these capabilities.
07 Looking Ahead: Valuation in an Accelerating Transition
The energy transition continues accelerating, with renewable capacity additions reaching record levels in 2025-2026 while conventional energy investment remains constrained. This dynamic creates both valuation challenges and opportunities.
For traditional energy assets, the key question is not whether transition occurs but how quickly. Assets with low breakeven costs, minimal carbon intensity, and strong ESG governance will retain value longest. High-cost, high-carbon assets face increasing impairment risk, particularly as carbon pricing mechanisms expand globally. Valuation professionals must explicitly model these dynamics rather than assuming steady-state conditions.
For renewable energy assets, the challenge shifts to capturing value in increasingly competitive markets. As renewable penetration increases, merchant power prices face compression during high-production periods, reducing project economics. Energy storage, demand flexibility, and green hydrogen production emerge as critical complements to intermittent generation. Valuations must reflect these evolving market dynamics.
The convergence of traditional and renewable energy creates the most interesting opportunities. Companies that successfully manage hybrid portfolios—using cash flows from conventional assets to fund renewable growth while maintaining financial discipline—can create substantial value. However, this requires sophisticated capital allocation and the ability to operate across fundamentally different business models.
For valuation professionals, the energy transition demands continuous learning and methodological evolution. The frameworks that served the industry for decades remain relevant for conventional assets but must be complemented with new approaches for renewable infrastructure. Success requires fluency in both domains and the judgment to integrate them appropriately.
Tools like iValuate help professionals navigate this complexity by providing integrated valuation capabilities across both traditional and renewable energy assets, enabling the sophisticated analyses that modern energy valuation requires. As the energy landscape continues evolving, the ability to value diverse energy portfolios with technical rigor and strategic insight becomes an increasingly critical competitive advantage.