Table of Contents8 sections
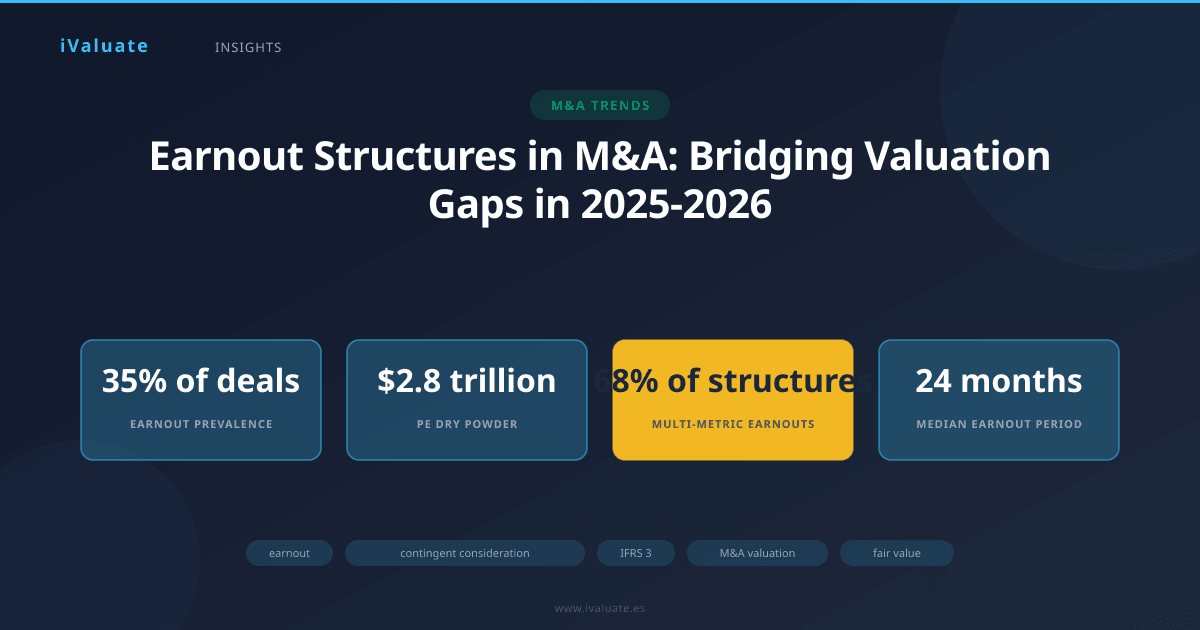
In the current M&A environment of 2025-2026, characterized by persistent valuation disconnects between buyers and sellers, earnout structures have evolved from occasional deal sweeteners to essential bridging mechanisms. With interest rates stabilizing after the aggressive tightening cycle and private equity dry powder exceeding $2.8 trillion globally, earnouts now appear in approximately 35% of middle-market transactions—up from 25% in 2019. This surge reflects not merely a tactical response to pricing disagreements, but a fundamental shift in how sophisticated parties structure risk allocation in an era of heightened uncertainty.
The earnout mechanism—formally classified as contingent consideration under accounting standards—represents a deferred payment structure where a portion of the purchase price depends on the target company achieving specified performance metrics post-closing. While conceptually straightforward, the technical implementation, valuation methodology, and accounting treatment involve considerable complexity that directly impacts deal economics, financial reporting, and stakeholder expectations.
01 The Economic Rationale Behind Earnout Proliferation
The dramatic increase in earnout utilization stems from several converging factors in today's deal landscape. First, the valuation gap between buyer and seller expectations has widened significantly. Sellers, particularly founder-owned businesses and venture-backed companies, often anchor their expectations to peak multiples observed during 2021-2022, when median EV/EBITDA multiples for technology companies reached 18-22x. Buyers, conversely, have recalibrated to a more disciplined pricing environment, with current multiples settling in the 10-14x range for quality assets.
Second, the performance visibility horizon has shortened. Macroeconomic volatility, rapid technological disruption (particularly AI-driven business model changes), and evolving regulatory landscapes make three-year projections substantially less reliable than historical norms. Earnouts effectively transform this uncertainty into a shared risk-reward framework rather than forcing one party to bear the entire forecasting risk.
Third, the composition of deal participants has shifted. Strategic acquirers increasingly compete with financial sponsors who possess sophisticated earnout structuring capabilities and portfolio company operational expertise to influence post-acquisition performance. This competitive dynamic has elevated earnout structures from simple revenue-based formulas to complex, multi-metric arrangements tied to EBITDA thresholds, customer retention rates, product development milestones, and integration synergy achievement.
Typical Earnout Structures in Current Market Practice
Modern earnout arrangements typically fall into several archetypal structures, each suited to different transaction contexts:
- Revenue-based earnouts: Common in high-growth technology and SaaS businesses where top-line momentum is the primary value driver. These typically range from 10-25% of total consideration and measure annual recurring revenue (ARR) or total revenue against predetermined thresholds over 12-36 month periods.
- EBITDA-based earnouts: Prevalent in mature, cash-generative businesses where profitability sustainability is paramount. These structures often employ tiered payout schedules—for example, 50% payout at 90% of target EBITDA, 100% at target, and 150% at 120% of target—creating both downside protection and upside participation.
- Milestone-based earnouts: Dominant in pharmaceutical, biotech, and technology sectors where specific binary events (FDA approval, product launch, patent issuance) drive value. These may represent 30-50% of total consideration in early-stage asset acquisitions.
- Hybrid structures: Increasingly sophisticated arrangements combining multiple metrics with weighted formulas, often including both financial performance and operational milestones. For instance, a recent software acquisition structured 60% of the earnout on ARR growth and 40% on gross margin expansion, recognizing that sustainable growth requires both revenue and unit economics improvement.
In a 2024 survey of 250 middle-market M&A transactions, 68% of earnouts included at least two distinct performance metrics, reflecting the growing sophistication of contingent consideration design.
02 Valuation Methodology: Fair Value Under IFRS 3 and ASC 805
The accounting treatment of earnouts underwent fundamental transformation with the adoption of IFRS 3 (Business Combinations) and its U.S. equivalent ASC 805, which mandate that contingent consideration be recognized at fair value on the acquisition date. This requirement represents a significant departure from legacy accounting where earnouts were often recorded only when payment became probable, and it introduces substantial complexity into purchase price allocation and post-acquisition financial reporting.
Initial Recognition and Measurement
Under IFRS 3, acquirers must recognize contingent consideration liabilities (or assets, in rare reverse earnout structures) at fair value as of the acquisition date. This fair value becomes part of the total consideration transferred and directly impacts goodwill calculation. The standard does not prescribe a specific valuation technique, but market practice has converged around probability-weighted scenario analysis and option pricing models, depending on earnout structure complexity.
For straightforward earnouts with clear performance thresholds, the probability-weighted expected return method predominates. Consider a practical example: An acquirer purchases a software company for $50 million upfront plus an earnout of up to $20 million if ARR exceeds $30 million in Year 2. The valuation analysis might proceed as follows:
- Scenario 1 (40% probability): ARR reaches $32 million → Full $20 million earnout paid
- Scenario 2 (35% probability): ARR reaches $28 million → $12 million earnout paid (pro-rata structure)
- Scenario 3 (25% probability): ARR reaches $25 million → $0 earnout paid (threshold not met)
The expected earnout value equals: (0.40 × $20M) + (0.35 × $12M) + (0.25 × $0) = $12.2 million. However, this must be discounted to present value using an appropriate risk-adjusted rate—typically the acquirer's incremental borrowing rate or a rate reflecting the specific risk profile of the earnout, often in the 8-12% range for middle-market transactions. Assuming a 10% discount rate over two years, the fair value would be approximately $10.1 million.
For complex earnouts with multiple interdependent variables or exotic payout structures (caps, floors, accelerators), Monte Carlo simulation or Black-Scholes option pricing models provide more robust valuations. These approaches explicitly model the volatility of underlying performance metrics and correlation between variables, producing probability distributions of potential outcomes rather than discrete scenarios.
Subsequent Measurement and Income Statement Impact
The post-acquisition accounting treatment diverges significantly based on earnout classification. IFRS 3 distinguishes between:
Contingent consideration classified as equity: These arrangements (rare in practice) are not remeasured after initial recognition. Changes in fair value do not flow through the income statement, and final settlement is recorded as an equity transaction.
Contingent consideration classified as liabilities: The overwhelming majority of earnouts fall into this category. These must be remeasured to fair value at each reporting date, with changes recognized in profit or loss. This creates significant earnings volatility—a critical consideration for public company acquirers and private equity portfolio companies preparing for exit.
Returning to our software company example: If at Year 1 reporting date, ARR growth exceeds initial expectations and the probability-weighted fair value increases to $14 million (from the initial $10.1 million), the acquirer must recognize a $3.9 million expense in the income statement. Conversely, if performance deteriorates and fair value declines to $7 million, a $3.1 million gain is recognized. This mark-to-market treatment can produce counterintuitive results where strong target performance generates acquisition-related expenses, while weak performance produces gains.
A 2025 analysis of S&P 500 acquirers revealed that earnout remeasurement adjustments averaged 180 basis points of quarterly earnings volatility for companies with material contingent consideration, highlighting the P&L impact of these structures.
03 Structuring Considerations: Aligning Incentives and Mitigating Disputes
The technical accounting treatment, while complex, represents only one dimension of earnout design. Equally critical are the commercial terms that govern measurement, dispute resolution, and operational control during the earnout period—factors that frequently become litigation flashpoints when inadequately addressed.
Defining Performance Metrics with Precision
Ambiguity in earnout metric definitions ranks among the most common sources of post-closing disputes. Revenue recognition policies, treatment of non-recurring items, allocation of corporate overhead, and transfer pricing methodologies all require explicit contractual specification. Best practice involves incorporating detailed calculation schedules as exhibits to the purchase agreement, often running 10-15 pages for sophisticated structures.
Consider EBITDA-based earnouts, which require agreement on numerous adjustments:
- Treatment of acquisition-related costs and integration expenses
- Allocation of shared services and corporate overhead post-acquisition
- Capitalization policies for software development or R&D expenditures
- Stock-based compensation treatment for retained seller employees
- Foreign exchange translation methodologies for cross-border businesses
- Treatment of extraordinary items, restructuring charges, and impairments
A representative clause might specify: "EBITDA shall be calculated in accordance with U.S. GAAP consistently applied, excluding (i) all acquisition-related transaction costs, (ii) integration expenses directly attributable to the acquisition not exceeding $2 million annually, (iii) non-cash stock compensation expense, and (iv) corporate overhead allocated to the Business not exceeding the historical run-rate average of the twelve months preceding Closing."
Operational Control and Seller Involvement
The tension between buyer operational control and seller earnout interests creates inherent agency conflicts. Buyers acquire businesses to integrate them, realize synergies, and optimize across their broader portfolio—actions that may conflict with maximizing standalone earnout metrics. Sellers, conversely, seek to preserve the conditions that enable earnout achievement while often lacking formal governance rights post-closing.
Sophisticated earnout agreements address this through several mechanisms:
Negative covenants: Restricting buyer actions that would materially impair earnout achievement, such as prohibitions on significant customer or product line divestitures, material changes to pricing strategy, or reductions in sales and marketing investment below specified thresholds.
Affirmative covenants: Requiring the buyer to operate the business in the ordinary course consistent with past practice, maintain working capital at specified levels, and provide resources necessary for earnout metric achievement.
Seller involvement provisions: Granting key sellers (often retained as employees or consultants) defined roles in strategic decisions affecting earnout metrics, such as approval rights over annual budgets, major customer contracts, or product development priorities.
A mid-market technology acquisition in Q3 2025 illustrates balanced structuring: The seller CEO remained as business unit president with a three-year employment agreement, the earnout measured standalone business unit EBITDA (eliminating corporate allocation disputes), and the buyer committed to minimum annual marketing expenditure equal to 15% of revenue—the historical average. This structure aligned incentives while preserving buyer flexibility for broader portfolio optimization.
04 Tax Implications and Structuring Optimization
The tax treatment of earnouts adds another layer of complexity, with significant implications for both parties' after-tax economics. The characterization of earnout payments—as additional purchase price, compensation, or something hybrid—drives dramatically different tax consequences.
Seller Tax Considerations
For sellers, the critical distinction lies between capital gains treatment and ordinary income characterization. Earnout payments structured as contingent purchase price generally qualify for capital gains treatment, preserving the favorable tax rates that motivated the sale. However, if the seller remains employed and earnout achievement depends substantially on personal services, tax authorities may recharacterize payments as compensation subject to ordinary income rates and employment taxes.
The IRS and tax authorities globally scrutinize several factors:
- Whether earnout payments are contingent on continued employment versus business performance
- The relationship between earnout metrics and seller's individual efforts versus broader business factors
- Whether earnout terms mirror typical employment compensation arrangements
- The proportion of total consideration represented by the earnout (higher percentages suggest compensation)
Careful structuring can preserve capital gains treatment even when sellers remain employed. Key protective measures include: (i) making earnout payments to all selling shareholders pro-rata regardless of employment status, (ii) tying metrics to objective business performance rather than individual contributions, (iii) providing for earnout payment even if employment terminates (except for cause), and (iv) documenting that earnout represents genuine valuation uncertainty rather than employment retention.
Buyer Tax and Financial Reporting Considerations
For buyers, earnout classification impacts deductibility and timing of tax benefits. Earnout payments characterized as purchase price increase the tax basis of acquired assets (including goodwill) but generate tax benefits only through future amortization or upon eventual disposition. Conversely, payments characterized as compensation are immediately deductible against ordinary income.
This creates a natural tension: sellers prefer purchase price treatment for capital gains, while buyers may prefer compensation characterization for immediate deductibility. In practice, purchase price treatment typically prevails because sellers negotiate from a position of strength on this issue—they're selling an asset and expect capital gains treatment as a fundamental deal premise.
The accounting treatment under IFRS 3, however, operates independently of tax characterization. Even if earnout payments are deductible as compensation for tax purposes, they must still be recorded as contingent consideration and remeasured through profit or loss for financial reporting purposes, creating book-tax differences that require careful reconciliation.
05 Real-World Case Studies: Earnouts in Practice
Case Study 1: SaaS Platform Acquisition with Revenue-Based Earnout
In early 2025, a strategic acquirer purchased a vertical SaaS platform serving the healthcare industry for $85 million upfront plus an earnout of up to $35 million based on ARR growth over 24 months. The earnout structure provided for:
- $0 payment if Year 2 ARR below $45 million
- Pro-rata payment from $0-$35 million for ARR between $45-55 million
- Full $35 million if ARR exceeds $55 million
At closing, management projections indicated 65% probability of achieving $52 million ARR, 25% probability of $48 million, and 10% probability of $43 million. The initial fair value calculation yielded $23.8 million (probability-weighted and discounted), which was recorded as a liability with corresponding increase to goodwill.
Six months post-closing, customer churn increased due to integration disruptions, and revised projections showed only 40% probability of exceeding the $45 million threshold. The remeasured fair value declined to $14.2 million, generating a $9.6 million gain in the acquirer's Q2 2025 earnings—ironically benefiting reported profits despite operational underperformance. This case illustrates the counterintuitive P&L impacts of earnout accounting and the importance of clear communication with investors about earnout-related earnings volatility.
Case Study 2: Manufacturing Company with EBITDA-Based Earnout Dispute
A private equity firm acquired a specialty manufacturing business in Q4 2024 for $120 million plus an earnout of up to $30 million based on achieving $18 million of EBITDA in Year 1 post-closing. The purchase agreement defined EBITDA with standard adjustments but failed to address allocation of corporate overhead for shared services (IT, HR, finance) that the buyer centralized post-acquisition.
The business generated $19.2 million of EBITDA using the seller's historical methodology, but the buyer allocated $2.8 million of corporate overhead, reducing EBITDA to $16.4 million and eliminating the earnout payment. The seller initiated arbitration, arguing that overhead allocation was inconsistent with pre-closing practice and impaired earnout achievement in violation of the covenant to operate in the ordinary course.
The arbitrator ultimately ruled in favor of a compromise allocation methodology, awarding the seller $18 million of the $30 million earnout. However, the dispute consumed 14 months and over $1.2 million in legal and expert fees for both parties. This case underscores the critical importance of exhaustive specificity in defining earnout metrics and anticipating post-acquisition operational changes.
Case Study 3: Biotech Milestone-Based Earnout Success
A pharmaceutical company acquired a clinical-stage biotech developing a novel oncology therapy for $200 million upfront plus milestone payments totaling up to $400 million: $100 million upon Phase III trial initiation, $150 million upon FDA approval, and $150 million upon achieving $500 million in cumulative sales.
At acquisition, the probability-weighted fair value of milestone payments was assessed at $145 million based on: 70% probability of Phase III initiation, 45% probability of FDA approval (conditional on Phase III), and 35% probability of commercial success (conditional on approval). The long time horizons (4-8 years) and high discount rates (12-15% reflecting development risk) significantly reduced present values.
This structure effectively allocated development risk between parties: the acquirer paid a substantial upfront sum reflecting the asset's clinical progress to date, while the seller retained meaningful upside if the therapy succeeded. The milestone structure also provided the seller with liquidity events tied to value inflection points rather than requiring them to wait for ultimate commercial success. As of mid-2025, Phase III trials are progressing favorably, and the remeasured fair value has increased to $198 million, generating $53 million of expense for the acquirer but reflecting genuine value creation in the acquired asset.
06 Emerging Trends and Future Outlook
Several trends are reshaping earnout structures as we progress through 2025-2026:
ESG-linked earnouts: Approximately 8% of earnouts in 2025 now incorporate environmental, social, or governance metrics, particularly in sectors where sustainability performance drives long-term value. These might include carbon emission reduction targets, diversity metrics, or supply chain sustainability scores, often weighted at 10-20% of total earnout value alongside financial metrics.
AI and technology-driven metric verification: Blockchain-based smart contracts and AI-powered financial analysis tools are beginning to automate earnout calculation and verification, reducing disputes and administrative burden. Several major law firms have developed automated earnout calculation platforms that continuously monitor performance metrics and provide real-time fair value estimates.
Shorter earnout periods: The median earnout period has compressed from 36 months in 2019 to 24 months in 2025, reflecting reduced confidence in long-term forecasting and seller preference for faster liquidity. However, this compression often comes with higher earnout percentages—now averaging 22% of total consideration versus 18% historically.
Sophisticated dispute resolution mechanisms: Earnout agreements increasingly incorporate tiered dispute resolution with mandatory mediation before arbitration, expert determination for technical accounting disputes, and detailed procedural rules that accelerate resolution. Some agreements now include "baseball arbitration" provisions where each party proposes a final earnout amount and the arbitrator must choose one without modification, encouraging reasonable positions.
07 Practical Implications for Deal Professionals
For CFOs, M&A advisors, and private equity professionals navigating earnout structures, several practical imperatives emerge from this analysis:
Model the accounting impact comprehensively: Before agreeing to earnout terms, model the full range of potential fair value outcomes and their P&L impact across multiple scenarios. Public company acquirers should prepare investor communication strategies addressing earnout-related earnings volatility. Private equity firms should consider earnout impacts on portfolio company EBITDA and debt covenant compliance.
Invest in contractual precision: The incremental legal cost of exhaustive earnout metric definition and operational covenant drafting—typically $25,000-75,000—is trivial compared to dispute resolution costs and relationship damage. Engage accounting experts during drafting to pressure-test metric definitions against real-world scenarios.
Align earnout metrics with integration strategy: Earnout structures should complement, not conflict with, post-acquisition integration plans. If significant integration is planned, consider earnout metrics that measure consolidated performance or explicitly adjust for integration impacts rather than standalone metrics that create perverse incentives.
Consider earnout alternatives: In some contexts, alternative structures may achieve similar risk allocation with less complexity: seller financing with performance-based interest rates, equity rollovers with ratchet provisions, or deferred cash payments with performance-based adjustments. Evaluate these alternatives before defaulting to traditional earnout structures.
Leverage technology for administration: Purpose-built platforms can dramatically reduce earnout administration burden and dispute risk. These tools maintain single sources of truth for performance data, automate calculations according to contractual formulas, and provide audit trails that facilitate resolution if disputes arise.
08 Conclusion: Earnouts as Strategic Tools in Modern M&A
Earnout structures have evolved from relatively simple contingent payment mechanisms to sophisticated risk allocation instruments that enable transactions that might otherwise fail due to valuation gaps or uncertainty. The technical complexity—spanning valuation methodology, accounting treatment under IFRS 3, tax implications, and contractual drafting—requires multidisciplinary expertise and careful attention to detail.
As we progress through 2025-2026, earnouts will likely remain prevalent given persistent macroeconomic uncertainty, rapid technological change, and the fundamental challenge of valuing businesses in dynamic environments. The most successful dealmakers will be those who approach earnouts not as necessary evils but as strategic tools that, when properly structured, align incentives, allocate risk efficiently, and enable value creation for both buyers and sellers.
The accounting implications under IFRS 3—particularly the requirement to recognize contingent consideration at fair value and remeasure through profit or loss—demand that acquirers think carefully about earnings impact and investor communication. The fair value methodology, whether probability-weighted scenarios or option pricing models, requires rigorous analysis and supportable assumptions that will withstand auditor scrutiny and potential litigation.
For professionals navigating these complexities, platforms like iValuate provide sophisticated tools to model earnout scenarios, calculate fair values under various methodologies, and analyze the accounting and financial implications of different earnout structures. As earnouts become increasingly central to M&A practice, the ability to rapidly model alternatives and quantify their impacts becomes a competitive advantage in deal origination, structuring, and execution.
Ultimately, successful earnout implementation requires balancing technical precision with commercial pragmatism—ensuring that contractual terms are sufficiently detailed to prevent disputes while remaining flexible enough to accommodate the inevitable changes that occur post-acquisition. Those who master this balance will find earnouts to be powerful instruments for bridging valuation gaps and consummating transactions that create genuine value for all stakeholders.