Table of Contents9 sections
As climate-related financial disclosures transition from voluntary best practice to regulatory requirement across major jurisdictions, corporate valuation professionals face a fundamental challenge: how to quantify climate risk in discounted cash flow models with the same rigor applied to traditional financial variables. The Task Force on Climate-related Financial Disclosures (TCFD) framework, now endorsed by regulators in the EU, UK, and increasingly in North America, provides the architecture for this integration—but translating climate scenarios into defensible cash flow adjustments requires both technical precision and strategic judgment.
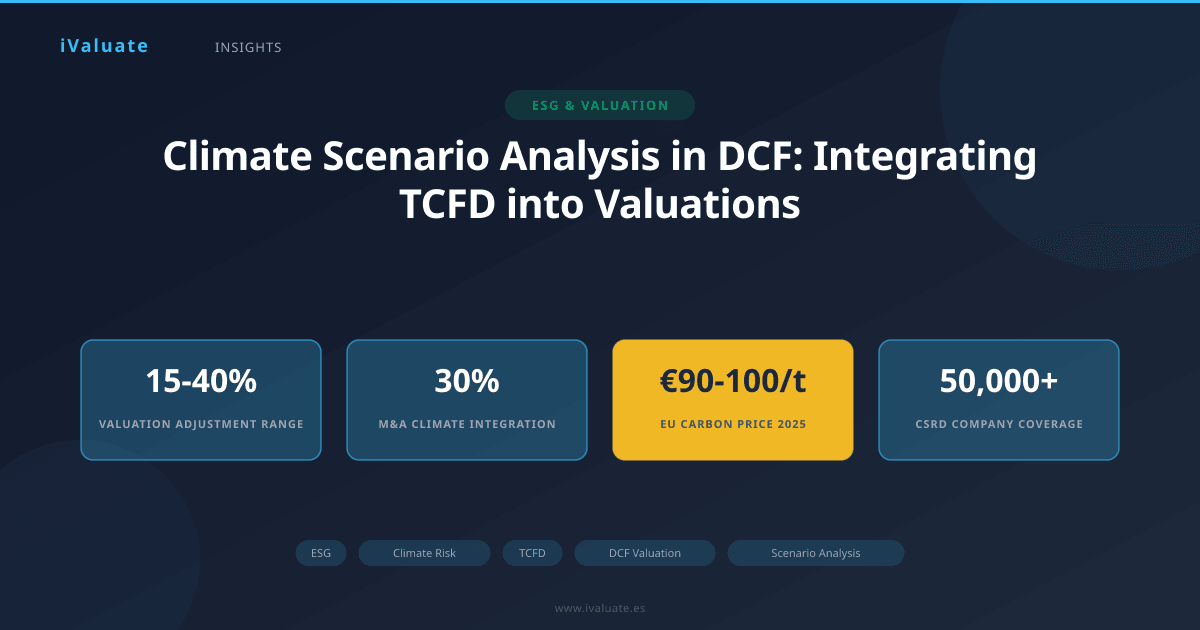
The stakes are considerable. A 2024 study by the Network for Greening the Financial System found that under a disorderly transition scenario (delayed action followed by abrupt policy changes), corporate valuations in carbon-intensive sectors could face downward adjustments of 15-40% by 2030. Yet as of early 2025, fewer than 30% of M&A transactions explicitly incorporate climate scenario analysis into their valuation work, according to PwC's Global M&A Trends report. This gap between regulatory expectation and market practice creates both risk and opportunity for valuation professionals.
01 Understanding TCFD Climate Scenarios
The TCFD framework distinguishes between two fundamental categories of climate-related financial risk, each requiring distinct analytical approaches in DCF modeling:
Physical risks encompass the direct impacts of climate change on business operations and assets. These include acute risks (extreme weather events, floods, wildfires) and chronic risks (rising temperatures, sea level rise, changing precipitation patterns). For a manufacturing facility in coastal Florida, physical risk might manifest as increased insurance costs, supply chain disruptions, or ultimately asset impairment. For an agricultural business, chronic temperature shifts could fundamentally alter crop yields and revenue potential.
Transition risks arise from the shift toward a lower-carbon economy. These encompass policy changes (carbon pricing, emissions regulations), technological disruption (electrification, renewable energy), market shifts (changing consumer preferences), and reputational factors. A coal-fired power plant faces transition risk not from hurricanes but from carbon taxes, renewable energy competition, and potential stranded asset scenarios.
The TCFD recommends analyzing at least two scenarios: a 2°C or lower pathway (aligned with Paris Agreement targets) and a business-as-usual scenario leading to 3-4°C warming. Many sophisticated practitioners now model three scenarios: an orderly transition (early, gradual policy action), a disorderly transition (delayed then abrupt action), and a hot house world (limited mitigation, high physical risk).
02 Quantifying Physical Risk in Cash Flow Projections
Physical climate risks translate into DCF models through multiple channels, each requiring specific analytical approaches:
Revenue Impact Modeling
Physical risks can directly affect top-line performance through reduced operational capacity, supply chain disruptions, or demand shifts. Consider a European ski resort operator: under a 2°C scenario, average snow season length in mid-altitude resorts is projected to decline by 20-30 days by 2040 according to the European Environment Agency. This translates directly into reduced visitor days and revenue.
The analytical approach involves:
- Identifying physical climate variables material to revenue generation (temperature, precipitation, extreme weather frequency)
- Sourcing climate projections from credible models (IPCC, regional climate assessments) for relevant time horizons
- Establishing quantitative relationships between climate variables and business performance using historical data or engineering studies
- Applying scenario-specific climate projections to forecast revenue impacts across the DCF projection period
For the ski resort example, if current annual revenue is €50 million with 120 operational days, and climate projections indicate a reduction to 90 days by 2040 under a 2°C scenario, the revenue impact would be approximately 25%, assuming proportional relationship between operating days and revenue. This would be phased in gradually across the projection period, perhaps 1-2% annual degradation from year 5 onward.
Operating Cost Adjustments
Physical risks frequently manifest as increased operating expenses before affecting revenue. A logistics company operating in the U.S. Gulf Coast might face:
- Higher insurance premiums: 3-5% annual increases above inflation as insurers price in elevated hurricane risk
- Increased maintenance costs: 2-3% premium for climate-proofing infrastructure
- Energy cost volatility: extreme heat events driving cooling costs up 15-20% during summer months
- Supply chain redundancy costs: maintaining alternative suppliers and routes adding 1-2% to procurement costs
These adjustments should be modeled with increasing severity across scenarios. Under a 2°C pathway with moderate physical risk, the cumulative EBITDA margin impact might be 150-200 basis points by 2035. Under a 4°C high-physical-risk scenario, the same company could see 400-500 basis points of margin compression.
Capital Expenditure Requirements
Physical climate adaptation often requires significant capital investment. A coastal manufacturing facility might need to invest in flood defenses, backup power systems, or ultimately facility relocation. These should be modeled as scenario-specific capex additions.
A pharmaceutical manufacturer with facilities in flood-prone areas might face:
- Baseline scenario: €5 million annual maintenance capex
- 2°C scenario: Additional €15 million over 5 years for flood protection and backup systems
- 4°C scenario: €80 million facility relocation by 2038, plus interim protection measures
Physical risk modeling requires granular asset-level analysis. Generic sector assumptions are insufficient—two companies in the same industry can have vastly different physical risk profiles based on geographic footprint, supply chain configuration, and asset age.
03 Integrating Transition Risk into DCF Models
Transition risks often present more immediate and material valuation impacts than physical risks, particularly for carbon-intensive sectors. The analytical framework differs substantially from physical risk modeling.
Carbon Pricing and Regulatory Costs
Carbon pricing represents the most direct and quantifiable transition risk. As of 2025, carbon pricing mechanisms cover approximately 24% of global emissions, with prices ranging from €15/tonne in emerging schemes to €90-100/tonne in the EU ETS. The trajectory matters enormously for valuation.
For a cement manufacturer emitting 800,000 tonnes of CO2 annually with limited near-term abatement options:
- Orderly transition scenario: Carbon price rises from €90/tonne (2025) to €150/tonne (2035) following a smooth trajectory. Annual carbon cost increases from €72 million to €120 million, assuming 20% emissions reduction through efficiency improvements. Present value impact: approximately €180 million at 8% WACC.
- Disorderly transition scenario: Carbon price remains at €90-100/tonne until 2028, then jumps to €200/tonne by 2032 as delayed policy action creates market shock. Limited time for abatement investment means higher ongoing costs. Present value impact: approximately €240 million.
- Hot house scenario: Carbon pricing remains weak (€40-60/tonne) but physical risks and reputational damage increase. Different risk profile, potentially lower near-term cash flow impact but higher terminal value uncertainty.
The carbon pricing assumption should be explicitly stated and sourced from credible scenarios (IEA, NGFS, or jurisdiction-specific policy roadmaps). Many practitioners now include carbon price as a sensitivity variable alongside WACC and terminal growth rate.
Technology Disruption and Stranded Assets
Transition risk can render assets economically obsolete before their physical end-of-life. This requires adjustments to both depreciation schedules and terminal value assumptions.
Consider an automotive supplier manufacturing exclusively internal combustion engine components. Under baseline assumptions, the manufacturing facility might have a 25-year useful life with terminal value calculated assuming perpetual operations. Under a 2°C scenario with aggressive EV adoption:
- Accelerated depreciation: useful life reduced to 15 years as ICE demand collapses
- Impairment charges: €30 million write-down in year 3 as market shift becomes apparent
- Terminal value adjustment: apply 0.5x revenue multiple instead of 1.2x to reflect declining industry economics
- Working capital release: model inventory obsolescence and accelerated receivables collection
The stranded asset analysis should consider both demand-side factors (market shift away from high-carbon products) and supply-side factors (competitors with lower-carbon alternatives gaining market share).
Revenue Opportunities from Transition
Climate scenarios aren't purely downside. Companies positioned to benefit from the low-carbon transition may see material upside in scenario analysis. A building materials company with low-carbon concrete technology might model:
- Market share gains: 5-8 percentage points over 10 years as green building standards tighten
- Price premiums: 10-15% premium for certified low-carbon products in 2°C scenario
- New market access: €50 million annual revenue from markets with strict carbon requirements
These opportunities should be modeled conservatively with appropriate probability weightings and competitive response assumptions. The temptation to over-estimate green revenue potential is significant; rigorous market sizing and competitive analysis are essential.
04 Practical Implementation Framework
Integrating climate scenarios into DCF models requires a structured, defensible methodology. Based on current best practice among leading advisory firms and institutional investors, the following framework provides a practical roadmap:
Step 1: Materiality Assessment and Scenario Selection
Begin with a climate risk materiality assessment specific to the target company. This involves:
- Asset-level geographic exposure analysis using climate hazard mapping tools
- Emissions footprint analysis (Scope 1, 2, and material Scope 3 categories)
- Regulatory exposure assessment based on jurisdictional climate policies
- Supply chain vulnerability mapping for key inputs and distribution channels
Select scenarios based on materiality findings. A coastal real estate portfolio requires emphasis on physical risk scenarios; a fossil fuel producer requires detailed transition risk modeling. Most companies need both, but the relative weighting differs.
The three-scenario approach (orderly transition, disorderly transition, hot house world) provides comprehensive coverage, but simpler two-scenario analysis (2°C vs. 4°C) may suffice for initial integration or lower-materiality situations.
Step 2: Translate Scenarios into Financial Assumptions
This is where climate science meets financial modeling. For each scenario, develop specific assumptions for:
- Revenue drivers: volume impacts, pricing effects, market share shifts, new product opportunities
- Cost structure: carbon costs, energy prices, raw material costs, insurance premiums, adaptation costs
- Capital intensity: transition capex (decarbonization technology, renewable energy), adaptation capex (physical risk mitigation), stranded asset write-offs
- Working capital: inventory obsolescence, payment term changes, supply chain financing needs
Document the analytical chain from climate variable to financial impact. For example: "2°C scenario → carbon price of €150/tonne by 2035 (IEA NZE) → €120M annual carbon cost → €90M after 25% abatement from €200M capex investment → 180bp EBITDA margin impact."
Step 3: Build Scenario-Specific DCF Models
Rather than attempting to incorporate all scenarios into a single model with switches and toggles, many practitioners find it clearer to build separate DCF models for each scenario. This approach:
- Makes assumptions transparent and auditable
- Allows scenario-specific WACC adjustments (discussed below)
- Facilitates clear communication of scenario impacts to stakeholders
- Enables probability-weighted valuation synthesis
Each scenario model should include the same projection period (typically 10 years for climate-sensitive valuations, longer than the traditional 5 years to capture medium-term climate impacts) and consistent baseline assumptions for non-climate variables.
Step 4: Adjust Discount Rates for Climate Risk
The treatment of climate risk in the discount rate remains contentious. Three approaches are currently used in practice:
Approach 1: Climate-neutral WACC with scenario-specific cash flows. This approach argues that climate risks are largely systematic (affecting all companies) and should be reflected in cash flows rather than discount rates. This is the most common approach and aligns with TCFD guidance to make climate assumptions explicit in cash flow projections.
Approach 2: Scenario-specific WACC adjustments. Some practitioners argue that transition risk in particular creates company-specific risk that should be reflected in the cost of equity. A coal mining company might see a 100-200bp cost of equity premium in a 2°C scenario reflecting stranded asset risk and refinancing challenges. This approach is more common in high-transition-risk sectors.
Approach 3: Separate climate risk premium. A few sophisticated institutional investors now apply an explicit climate risk premium to the discount rate, typically 50-150bp depending on sector and scenario. This approach is evolving and not yet standard practice.
For most applications, Approach 1 (climate-neutral WACC with scenario-specific cash flows) provides the most transparent and defensible methodology, with sensitivity analysis showing valuation impact under alternative discount rate assumptions.
Step 5: Calculate Probability-Weighted Valuation
With scenario-specific valuations complete, synthesize into a single valuation range or point estimate using probability weights. The probability assignment requires judgment but should be informed by:
- Current policy trajectories and commitments (NDCs, net-zero pledges)
- Technological progress and cost curves (renewable energy, batteries, carbon capture)
- Market signals (investor behavior, consumer preferences, corporate commitments)
- Expert consensus (IPCC likelihood assessments, climate scenario literature)
As of 2025, a reasonable probability distribution might be:
- Orderly transition (≤2°C): 30-40% probability
- Disorderly transition (2-3°C): 40-50% probability
- Hot house world (>3°C): 15-25% probability
These probabilities should be updated regularly as policy and technology developments unfold. The 2024-2025 period saw significant policy acceleration in the EU and China, potentially increasing orderly transition probability, while slower progress in other major emitters maintains substantial disorderly transition risk.
Probability-weighted valuation provides a single point estimate, but the scenario-specific valuations are often more valuable for decision-making. A company worth €500M in an orderly transition but €200M in a disorderly transition faces very different strategic imperatives than one with €450M and €400M valuations across the same scenarios.
05 Real-World Application: Three Case Examples
Case 1: European Utility with Coal and Renewable Assets
A mid-sized European utility with 40% coal generation, 30% gas, and 30% renewables underwent climate scenario valuation in a 2024 M&A process. The analysis revealed:
- Orderly transition scenario: Coal assets fully stranded by 2035, requiring €800M in decommissioning costs but offset by €1.2B in renewable expansion opportunities. Net valuation: €3.8B.
- Disorderly transition scenario: Abrupt coal phase-out by 2030 with inadequate time for managed transition. Stranded asset write-offs of €600M, limited renewable expansion due to supply chain constraints and capital availability. Net valuation: €2.9B.
- Hot house scenario: Coal assets operate longer but face increasing carbon costs (€120/tonne by 2035) and reputational damage limiting refinancing options. Renewable assets face physical risks (extreme weather affecting wind and solar output). Net valuation: €3.1B.
The probability-weighted valuation of €3.4B represented a 15% discount to the pre-climate-analysis valuation of €4.0B. More importantly, the scenario analysis revealed that accelerated renewable investment was value-accretive across all scenarios, informing both the acquisition strategy and post-acquisition business plan.
Case 2: Agricultural Business with Geographic Concentration
A North American agricultural business with operations concentrated in the U.S. Midwest faced material physical climate risk. The scenario analysis focused on crop yield impacts:
- 2°C scenario: Moderate temperature increase with adaptation (drought-resistant varieties, irrigation investment) maintaining 90-95% of baseline yields. Adaptation capex of €40M over 10 years. Valuation impact: -8%.
- 4°C scenario: Severe yield impacts (20-30% reduction in key crops by 2040) with limited adaptation effectiveness. Potential geographic shift of operations requiring €200M+ in new facility investment. Valuation impact: -35%.
The analysis prompted the acquirer to negotiate a 12% purchase price reduction and structure earnouts tied to successful adaptation implementation, effectively transferring some physical risk to the seller.
Case 3: Industrial Manufacturer with Transition Opportunities
A manufacturer of industrial equipment developed a low-carbon product line that represented 15% of revenue in 2024. Climate scenario analysis revealed significant upside potential:
- Orderly transition: Low-carbon products grow to 60% of revenue by 2035 with 8-10% price premiums and improving margins as scale increases. Valuation uplift: +25%.
- Disorderly transition: Faster market shift but supply chain constraints and competitive pressure limit margin expansion. Valuation uplift: +15%.
- Hot house: Limited policy support for low-carbon products; growth stalls at 25% of revenue. Valuation impact: +5%.
The analysis supported a premium valuation multiple and informed capital allocation toward accelerating low-carbon product development and manufacturing capacity.
06 Data Sources and Analytical Tools
Rigorous climate scenario analysis requires access to credible data sources and analytical capabilities:
Climate Scenario Data
- NGFS Climate Scenarios: Provides macroeconomic and sectoral projections across six scenarios, updated regularly. Essential for carbon pricing and GDP impact assumptions.
- IEA World Energy Outlook: Detailed energy sector scenarios including technology deployment, pricing, and emissions pathways.
- IPCC Assessment Reports: Physical climate projections by region and emissions scenario, though requiring translation into business-relevant variables.
- Regional climate services: Copernicus (Europe), NOAA (U.S.), and national meteorological services provide localized climate projections.
Physical Risk Assessment Tools
- Jupiter Intelligence, Four Twenty Seven (Moody's), Climanomics: Commercial platforms providing asset-level physical risk scoring and financial impact estimates
- WRI Aqueduct: Water stress and flood risk mapping
- EU Adaptation Platform: European-focused climate hazard data
Transition Risk Data
- Carbon pricing databases (World Bank, ICAP)
- Sectoral decarbonization pathways (IEA, Science Based Targets initiative)
- Technology cost curves (BNEF, IEA, IRENA for renewable energy)
- Policy trackers (Climate Action Tracker, national NDC databases)
Integrating these diverse data sources into a coherent valuation framework remains challenging. Professional valuation platforms like iValuate are increasingly incorporating climate scenario functionality, allowing practitioners to model scenario-specific assumptions within a structured DCF framework and maintain consistency across multiple valuation engagements.
07 Regulatory Landscape and Disclosure Requirements
The regulatory environment for climate-related financial disclosure is evolving rapidly, directly impacting valuation practice:
European Union: The Corporate Sustainability Reporting Directive (CSRD), applicable to approximately 50,000 companies from 2024-2026, requires climate scenario analysis aligned with TCFD recommendations. The European Sustainability Reporting Standards (ESRS) specify that material climate risks must be quantified in financial terms, effectively mandating scenario-based valuation analysis for many companies.
United Kingdom: TCFD-aligned disclosure is mandatory for premium listed companies, large private companies, and LLPs since 2022, with scenario analysis required where material. The FCA has indicated increasing scrutiny of climate risk quantification in valuations for regulated transactions.
United States: The SEC's climate disclosure rules (finalized March 2024, implementation ongoing amid legal challenges) require material climate risk disclosure but stop short of mandating scenario analysis. However, many U.S. companies are voluntarily adopting TCFD-aligned scenario analysis to meet investor expectations and prepare for potential regulatory expansion.
ISSB Standards: The International Sustainability Standards Board's IFRS S2 Climate-related Disclosures standard, effective 2024, requires climate scenario analysis for companies with material climate risks. As jurisdictions adopt ISSB standards (including Canada, Australia, and others), scenario-based valuation will become increasingly standard practice globally.
For valuation professionals, these regulatory developments mean that climate scenario analysis is transitioning from optional best practice to expected standard of care, particularly for material transactions and regulated entities.
08 Common Pitfalls and How to Avoid Them
Based on reviews of hundreds of climate-adjusted valuations over the past three years, several common errors consistently appear:
Pitfall 1: Generic sector assumptions. Applying sector-average climate risk adjustments without company-specific analysis produces meaningless results. Two oil refineries can have vastly different transition risk profiles based on configuration, location, ownership structure, and strategic positioning.
Solution: Always conduct asset-level and business-unit-level analysis. Geographic specificity matters enormously for physical risk; product mix and technology vintage matter for transition risk.
Pitfall 2: Inconsistent scenario logic. Mixing assumptions from different scenarios (e.g., high carbon prices from a 2°C scenario with high physical damages from a 4°C scenario) produces internally inconsistent projections.
Solution: Maintain scenario coherence. Each scenario represents a distinct future pathway with internally consistent climate outcomes, policy responses, and economic conditions. Document the scenario source and ensure all assumptions align with that scenario's logic.
Pitfall 3: Double-counting risk in cash flows and discount rate. Reducing cash flows for climate risk and adding a climate risk premium to WACC counts the same risk twice.
Solution: Adopt a clear methodology (typically climate risk in cash flows, standard WACC) and apply it consistently. If using risk-adjusted discount rates, ensure the cash flows are unadjusted for that specific risk.
Pitfall 4: Ignoring adaptation and mitigation responses. Assuming companies passively accept climate impacts without strategic response understates resilience and overstates risk.
Solution: Model realistic management responses including adaptation investments, business model pivots, and decarbonization initiatives. These should be costed (capex, opex) but credited for risk reduction.
Pitfall 5: Excessive precision. Reporting climate-adjusted valuations to the nearest million when underlying assumptions have ±20% uncertainty ranges creates false confidence.
Solution: Present results as ranges and emphasize scenario comparison over point estimates. The insight is often in the spread between scenarios rather than the absolute numbers.
09 Looking Forward: Climate Scenarios as Standard Practice
The integration of climate scenario analysis into corporate valuation represents a fundamental evolution in how we assess long-term business value. As we move through 2025 and beyond, several trends will shape practice:
Regulatory convergence: The gap between jurisdictions is narrowing as ISSB standards gain adoption and major economies align around TCFD-based frameworks. By 2027, climate scenario analysis will likely be standard practice for material transactions globally, not just in Europe.
Data and tools maturation: The quality and accessibility of climate risk data continues to improve. Physical risk models are becoming more granular and validated; transition risk scenarios are incorporating more sophisticated economic modeling. Professional valuation platforms are embedding climate scenario capabilities, making sophisticated analysis more accessible to mid-market practitioners.
Investor expectations: Institutional investors increasingly expect to see climate scenario analysis in valuation materials. Private equity funds, in particular, are incorporating climate due diligence into standard investment processes, driven by both risk management and LP reporting requirements.
Litigation and liability: As climate disclosure regulations mature, the risk of liability for inadequate climate risk assessment in valuations is growing. Directors, auditors, and advisors face increasing scrutiny over whether material climate risks were properly identified and quantified.
The technical challenges are real—climate science is complex, scenarios are uncertain, and the analytical frameworks are still evolving. But the direction is clear: climate scenario analysis is becoming a core competency for valuation professionals, not an optional add-on. Those who develop rigorous, defensible methodologies now will be well-positioned as this becomes standard practice.
For practitioners looking to implement climate scenario analysis efficiently and consistently across engagements, professional platforms like iValuate provide structured frameworks that ensure methodological rigor while maintaining the flexibility to address company-specific circumstances. As climate considerations become embedded in every valuation, having robust analytical infrastructure becomes not just convenient but essential for maintaining professional standards and managing liability risk.
The integration of TCFD climate scenarios into DCF models represents more than a technical adjustment to valuation methodology—it reflects a fundamental recognition that long-term business value cannot be assessed without considering the physical and economic realities of climate change. As this practice matures from emerging best practice to professional standard, the quality and credibility of climate scenario analysis will increasingly differentiate sophisticated valuation work from superficial compliance exercises.