Table of Contents10 sections
In March 2025, a middle-market private equity firm nearly overpaid by $47 million for a retail technology company. Their initial comparable company analysis showed the target trading at an attractive 8.2x EV/EBITDA discount to peers. The problem? Half their comparables reported on calendar year-ends while the target and others used January 31 fiscal year-ends. After proper calendarization adjustments accounting for the critical holiday quarter, the actual discount narrowed to just 1.8x—barely justifying the complexity premium they'd assumed.
This scenario illustrates why calendarization represents one of the most technically demanding—yet frequently overlooked—aspects of building robust comparable company analyses. When companies report financial results on different fiscal calendars, direct comparison of multiples becomes analytically flawed and potentially misleading. For professionals conducting M&A valuations, fairness opinions, or portfolio company benchmarking, mastering timing adjustments separates sophisticated analysis from superficial screening.
01 The Fundamental Problem: Why Fiscal Calendars Matter
Fiscal year misalignment creates three distinct analytical challenges that compound to distort valuation multiples:
Temporal Mismatch: When comparing a company with a December 31 year-end to one with a June 30 year-end, you're effectively comparing financial performance from different six-month periods. In cyclical industries or those experiencing rapid growth, this six-month lag can represent dramatically different operating environments. A SaaS company growing at 45% annually will show materially different metrics in H1 versus H2 of the same calendar year.
Seasonality Distortion: Industries with pronounced seasonal patterns—retail, agriculture, construction, hospitality—concentrate revenue and profitability in specific quarters. A retailer with a January year-end captures the critical holiday season in Q4, while a March year-end retailer splits this crucial period across two fiscal years. This timing difference alone can shift reported annual EBITDA margins by 300-500 basis points.
Market Condition Divergence: Macroeconomic conditions, interest rates, commodity prices, and sector-specific dynamics evolve continuously. Financial results from fiscal 2024 (ending December 31, 2024) reflect different market conditions than fiscal 2024 (ending June 30, 2024). In volatile periods—such as the rapid interest rate increases of 2022-2023 or the AI investment surge of 2024-2025—these differences become material.
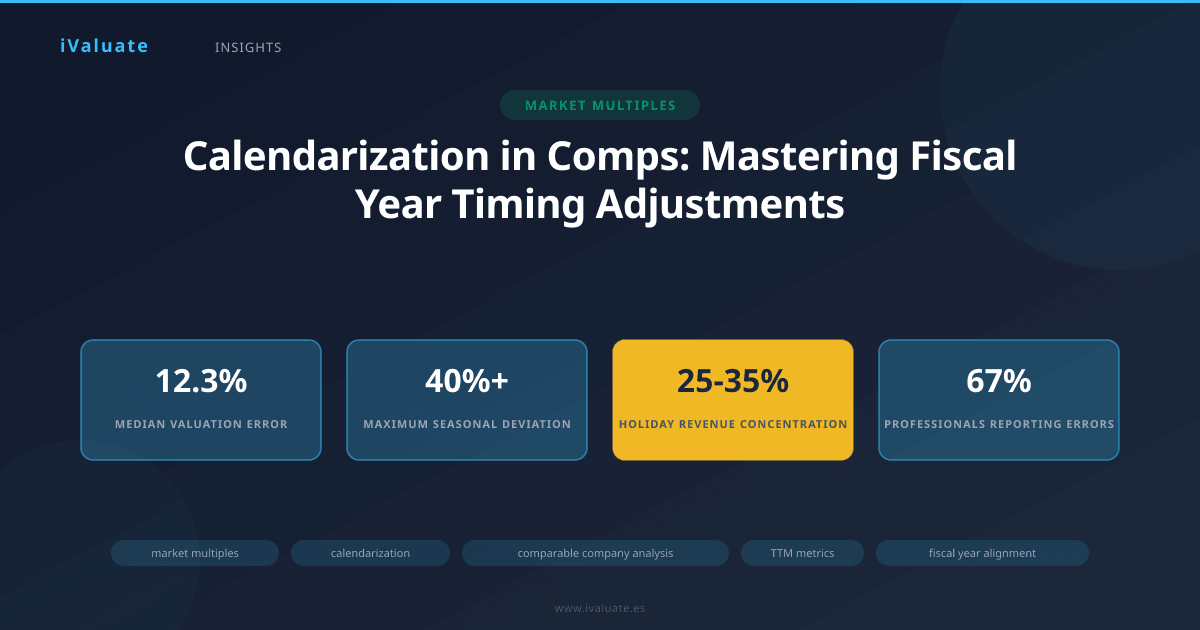
A 2024 study of 847 public company valuations found that failure to properly calendarize comparable company multiples introduced median valuation errors of 12.3%, with maximum deviations exceeding 40% in highly seasonal or rapidly growing sectors.
02 Understanding Trailing Twelve Months (TTM) Metrics
The trailing twelve months approach represents the most common solution to fiscal year misalignment. TTM metrics calculate financial performance for the most recent twelve-month period, regardless of fiscal year boundaries. For a company analyzed in March 2025, TTM revenue would encompass Q2 2024, Q3 2024, Q4 2024, and Q1 2025—the four most recent reported quarters.
Constructing TTM Financials
Building accurate TTM metrics requires careful attention to several technical considerations:
- Quarterly data availability: Public companies typically provide quarterly income statement data, but balance sheet and cash flow details may be limited. For private companies in a sell-side process, quarterly financials may require special preparation.
- Accounting consistency: Ensure the four quarters being summed use consistent accounting policies. Companies occasionally restate prior periods for accounting changes, acquisitions, or discontinued operations.
- Non-recurring adjustments: Identify one-time items in each quarter and maintain consistency in normalization approaches across all comparables.
- Segment reporting: When analyzing divisional performance or carve-outs, quarterly segment data may be less detailed than annual reporting.
For a practical example, consider analyzing a specialty chemicals manufacturer in February 2025. The company reports on a September 30 fiscal year-end and released Q1 FY2025 results (October-December 2024) in early February. To construct TTM metrics as of the latest available data:
- Q1 FY2025: October-December 2024 (most recent quarter)
- Q4 FY2024: July-September 2024
- Q3 FY2024: April-June 2024
- Q2 FY2024: January-March 2024
This TTM period (January 2024-December 2024) provides a calendar-year-equivalent view, enabling direct comparison with December year-end comparables reporting their full-year 2024 results.
TTM Limitations and Considerations
While TTM metrics solve temporal alignment, they introduce their own complexities. TTM calculations can mask inflection points in business performance. A company experiencing accelerating growth in recent quarters may appear less attractive on a TTM basis than on a most-recent-quarter annualized basis. Conversely, companies with deteriorating performance may look artificially strong when older, better quarters remain in the TTM calculation.
Additionally, TTM metrics require more data and calculation effort than simply using reported annual figures. For analyses involving dozens of comparables—common in broad industry studies or initial screening—this data collection burden becomes significant. This is where professional valuation platforms like iValuate provide substantial efficiency gains by automating TTM calculations across large comparable sets.
03 Advanced Calendarization Techniques
For situations requiring greater precision than standard TTM approaches—such as fairness opinions, litigation support, or large-cap M&A—analysts employ more sophisticated calendarization methodologies.
Stub Period Adjustments
Stub period calendarization involves creating synthetic financial periods that align precisely with target company reporting dates. This technique proves particularly valuable when analyzing companies with unusual fiscal year-ends or when precise temporal alignment is critical.
Consider a scenario where you're valuing a target company with a March 31 year-end as of December 31, 2024. Your comparable company uses a June 30 year-end. To create a perfectly aligned comparison period:
Step 1: Identify the alignment date (March 31, 2024 for the target's most recent fiscal year-end)
Step 2: Construct the comparable's financials for the twelve months ending March 31, 2024:
- Q3 FY2024 (January-March 2024): 3 months
- Q2 FY2024 (October-December 2023): 3 months
- Q1 FY2024 (July-September 2023): 3 months
- Q4 FY2023 (April-June 2023): 3 months
Step 3: Calculate the stub period by summing these four quarters to create a synthetic twelve-month period ending March 31, 2024
This approach ensures both companies' financials reflect identical time periods, eliminating temporal mismatch entirely. However, it requires quarterly data availability and becomes computationally intensive when applied across multiple comparables with varying fiscal calendars.
Weighted Average Calendarization
For companies with highly seasonal businesses, simple quarterly summation may inadequately capture intra-quarter dynamics. Weighted average calendarization applies proportional weighting to quarterly results based on the number of days falling within the target period.
Imagine calendarizing a ski resort operator with a September 30 year-end to align with a December 31 year-end comparable. The critical winter season (December-February) generates 65-70% of annual revenue. A simple quarterly approach would include either all or none of Q1 (October-December), creating significant distortion. Instead:
- October-November (61 days): Weight at 61/365 of Q1 results
- December (31 days): Weight at 31/365 of Q1 results, capturing the season start
- January-September: Include subsequent quarters appropriately
This granular approach requires assumptions about intra-quarter revenue and expense patterns but provides superior accuracy for highly seasonal businesses. In practice, analysts often use daily weighting for revenue (assuming relatively even distribution within quarters) while using quarterly weighting for expenses (which tend to be more evenly distributed).
04 Industry-Specific Calendarization Challenges
Retail and Consumer
Retail companies present the most acute calendarization challenges due to extreme holiday season concentration. The November-December period typically represents 25-35% of annual revenue for general retailers and 40-50% for toy, electronics, and gift-oriented merchants. A January or February year-end captures this critical period in a single fiscal year, while a June or July year-end splits it across two years.
When analyzing retail comparables in 2025, analysts must consider an additional complexity: the shift in consumer spending patterns toward earlier holiday shopping (October Prime Day events) and extended promotional periods. This evolution means the "holiday quarter" increasingly spans October-December rather than just November-December, affecting how stub periods should be constructed.
A practical example: In late 2024, a specialty apparel retailer with a January 28 year-end was being compared to peers with December 31 year-ends. The four-week difference meant the target's fiscal 2023 (ending January 28, 2024) included four additional weeks of post-holiday clearance sales—typically lower-margin revenue. Proper calendarization required adjusting for this stub period, which reduced reported EBITDA margins by 180 basis points and increased the implied valuation multiple by 0.8x.
Technology and Software
Technology companies, particularly in SaaS and cloud infrastructure, present different calendarization challenges. While less seasonally dependent than retail, these businesses often experience:
- Q4 budget flush: Enterprise customers accelerating purchases in December to utilize remaining annual budgets
- Renewal concentration: Many contracts renew on calendar-year boundaries, creating Q4 and Q1 concentration
- Rapid growth dynamics: High-growth companies (30%+ annual growth) show material quarter-over-quarter changes that make older quarters less relevant
For a SaaS company growing at 40% annually, Q1 revenue might be 8-10% higher than Q4 of the previous year. When constructing TTM metrics, this growth trajectory means recent quarters carry disproportionate economic relevance. Some analysts apply recency weighting or focus on forward-looking multiples (EV/NTM Revenue) to better capture growth momentum, though this introduces its own forecasting uncertainties.
Commodities and Cyclicals
Companies in commodity-exposed sectors—energy, metals and mining, agriculture, chemicals—face calendarization challenges driven by price volatility rather than seasonal demand patterns. A copper mining company's EBITDA in Q2 2024 (copper at $4.85/lb) differs dramatically from Q4 2024 (copper at $4.15/lb), even with identical production volumes.
For these businesses, calendarization must consider:
- Commodity price timing: Aligning periods when underlying commodity prices were similar
- Hedge positions: Companies may have different hedge ratios and maturities, affecting realized prices
- Volume vs. price effects: Separating production volume changes from price-driven revenue changes
Best practice involves normalizing commodity-exposed companies to mid-cycle pricing or current spot prices, then applying consistent normalization across all comparables regardless of fiscal period. This approach removes commodity timing effects while preserving operational performance comparability.
05 Practical Implementation Framework
Implementing robust calendarization in comparable company analysis requires a systematic approach:
Step 1: Fiscal Calendar Mapping
Create a comprehensive calendar mapping all comparables' fiscal year-ends, most recent reporting dates, and next expected reporting dates. This matrix immediately reveals alignment challenges and data availability constraints. In a typical analysis of 12-15 comparables, expect 4-6 different fiscal year-end dates.
Step 2: Determine Alignment Approach
Select the appropriate calendarization methodology based on:
- Data availability: Quarterly data accessible for all comparables?
- Seasonality intensity: High seasonality demands more precise alignment
- Analysis purpose: Screening analyses may accept TTM approximations; fairness opinions require stub period precision
- Time and resource constraints: Weighted average calendarization requires 3-5x more time than simple TTM
For most middle-market M&A analyses, TTM metrics provide an appropriate balance of accuracy and efficiency. Large-cap transactions, litigation support, and highly seasonal industries justify the additional effort of stub period or weighted average approaches.
Step 3: Data Collection and Normalization
Gather quarterly financial data from SEC filings (10-Q, 10-K), company presentations, and financial databases. Key data points include:
- Revenue (total and by segment if relevant)
- EBITDA (reported and adjusted)
- EBIT
- Net income
- Shares outstanding (for per-share metrics)
- Net debt components (for EV calculations)
Maintain detailed normalization schedules documenting adjustments for non-recurring items, accounting changes, and M&A activity. Consistency in normalization approaches across all comparables is essential—if you adjust one company for restructuring charges, apply the same standard to all peers.
Step 4: Calculate Aligned Metrics
Construct TTM or stub period financials for each comparable, ensuring temporal alignment with the target company or analysis date. For a March 2025 analysis:
- December year-end companies: Use Q4 2024 + Q1-Q3 2024 (if Q4 reported) or Q1-Q4 2024 TTM
- June year-end companies: Use Q1 FY2025 + Q2-Q4 FY2024 for TTM ending December 2024
- September year-end companies: Use Q1 FY2025 + Q2-Q4 FY2024 for TTM ending December 2024
Step 5: Validate and Sense-Check
Before finalizing multiples, validate calendarized metrics against reported annual figures. TTM EBITDA should approximate reported annual EBITDA for stable businesses (within 5-10% for low-growth companies). Larger variances signal either calculation errors or genuine inflection points requiring investigation.
Cross-reference implied growth rates and margin trends against company guidance, analyst estimates, and industry conditions. A calendarized metric showing 35% revenue growth when management guides to 15-20% suggests calculation errors or non-recurring items requiring adjustment.
06 Common Pitfalls and How to Avoid Them
Mixing Aligned and Unaligned Metrics: The most frequent error involves using TTM revenue with reported annual EBITDA, or vice versa. This inconsistency distorts margins and multiples. Always ensure numerator and denominator in any ratio use identically aligned periods.
Ignoring Acquisition Impacts: When comparables complete acquisitions mid-year, their TTM metrics include partial-period contributions from acquired businesses. Unless you're adjusting for pro forma full-period ownership, these metrics aren't comparable to organic peers. Document acquisition dates and consider excluding the acquisition quarter or applying pro forma adjustments.
Stale Comparables: Using comparables that haven't reported recent results creates temporal misalignment. If analyzing in March 2025, a comparable that last reported September 2024 results is effectively six months stale. Either exclude these comparables or apply estimated updates based on guidance and industry trends.
Overlooking Segment Mix Changes: Companies evolving their business mix (e.g., shifting from product to subscription revenue) may show different margin profiles across quarters. Simple TTM summation can create synthetic margin profiles that don't reflect current economics. Consider weighting recent quarters more heavily or using forward-looking metrics.
In a 2024 survey of 156 M&A professionals, 67% acknowledged making calendarization errors in at least one transaction, with 23% stating these errors materially affected valuation conclusions or deal terms.
07 Technology and Automation
The computational intensity of proper calendarization—particularly across large comparable sets or when performing sensitivity analyses with different alignment dates—makes automation increasingly valuable. Manual Excel-based approaches remain common but introduce several risks:
- Formula errors in quarter summation or weighting calculations
- Version control challenges when updating for new quarterly reports
- Limited audit trail for normalization adjustments
- Time constraints forcing analysts to accept TTM approximations when stub period precision would be preferable
Professional valuation platforms address these challenges through automated data integration, standardized calendarization algorithms, and systematic normalization frameworks. Modern tools can instantly recalculate entire comparable sets when new quarterly data becomes available, maintaining temporal alignment across dozens of companies with minimal manual intervention.
For firms conducting frequent comparable company analyses—investment banks, private equity funds, corporate development teams—the efficiency gains compound significantly. What might require 6-8 hours of manual quarterly data collection and calculation can be reduced to 30-45 minutes of review and validation, allowing analysts to focus on interpretive judgment rather than mechanical calculation.
08 Regulatory and Reporting Considerations
When calendarized analyses support formal valuation opinions—fairness opinions, solvency opinions, ESOP valuations, financial reporting valuations under ASC 820—documentation standards become critical. Regulatory scrutiny and potential litigation exposure demand comprehensive support for all calendarization decisions.
Best practice documentation includes:
- Explicit statement of calendarization methodology and rationale for approach selected
- Detailed calculation schedules showing quarterly data sources and summation
- Normalization adjustments with specific references to source documents (10-Q page numbers, press release dates)
- Sensitivity analyses showing valuation impact of alternative alignment approaches
- Validation procedures performed and results
For valuations subject to audit or regulatory review, expect questions about why specific calendarization approaches were selected and how alternative methodologies would affect conclusions. Preparedness to defend these technical decisions with clear, logical rationale separates defensible valuation work from vulnerable analyses.
09 Looking Forward: Emerging Considerations
Several evolving dynamics are reshaping calendarization practices in 2025 and beyond:
Increased Quarterly Reporting Granularity: More companies are providing detailed quarterly segment data, monthly metrics (particularly in SaaS), and real-time KPIs. This granularity enables more precise calendarization but also raises questions about which metrics deserve alignment effort versus accepting approximations.
ESG Metrics Integration: As environmental, social, and governance metrics increasingly influence valuations, analysts face new calendarization challenges. ESG data often reports on different calendars than financial data, and standardization remains limited. Aligning carbon emissions data, diversity metrics, or governance scores across different reporting periods adds complexity to comparable company analyses.
Private Company Comparables: Growing private capital markets mean more analyses incorporate private company comparables, which typically provide only annual or semi-annual data. Calendarizing these less-frequent reporters to align with quarterly-reporting public comparables requires interpolation assumptions and reduces precision.
Real-Time Valuation Demands: Portfolio companies, particularly in private equity and venture capital, increasingly expect quarterly or even monthly valuation updates. This cadence demands efficient calendarization workflows that can rapidly incorporate new quarterly reports across comparable sets without full-scale rebuilding of analyses.
10 Conclusion
Calendarization represents far more than a technical detail in comparable company analysis—it's a fundamental determinant of analytical validity. The difference between a superficial comparison of reported annual multiples and a properly calendarized analysis can easily reach 15-25% in implied valuation, with even larger variances in seasonal or high-growth sectors.
Mastering these timing adjustments requires understanding not just the mechanical techniques—TTM calculations, stub period construction, weighted averaging—but also the economic substance behind fiscal calendar differences. Why do companies select particular year-ends? How do seasonal patterns affect different fiscal periods? What market conditions prevailed during different reporting windows?
For professionals conducting M&A valuations, the stakes are substantial. A $500 million transaction with a 12% valuation error due to improper calendarization represents $60 million of value misattribution—enough to determine deal success or failure, fairness opinion defensibility, or litigation outcomes. The reputational and financial consequences of such errors far exceed the time investment required to implement robust calendarization practices.
As comparable company analysis continues evolving—incorporating more diverse peer sets, integrating alternative data sources, supporting more frequent valuation updates—the importance of systematic, defensible calendarization approaches only intensifies. Firms that invest in developing these capabilities, whether through enhanced analyst training, documented methodological frameworks, or technology platforms like iValuate that automate complex timing adjustments, position themselves to deliver more accurate, defensible valuations in an increasingly sophisticated market.
The question isn't whether calendarization matters—the data conclusively demonstrates it does. The question is whether your analyses reflect the precision and rigor that professional valuation work demands, or whether preventable timing misalignments are introducing material errors into critical financial decisions. In an environment where valuation accuracy directly translates to transaction outcomes, competitive positioning, and professional credibility, mastering calendarization techniques separates truly sophisticated analysis from superficial comparables screening.