Table of Contents12 sections
In the current environment of elevated interest rates and heightened scrutiny on cash generation, the ability to construct defensible free cash flow projections has become the cornerstone of credible corporate valuation. As we navigate 2025-2026, with the 10-year Treasury hovering around 4.5% and equity risk premiums compressed to approximately 5.8%, the margin for error in DCF modeling has narrowed considerably. This technical guide provides a comprehensive framework for building robust 5-year FCF projections that can withstand rigorous investor due diligence.
01 Understanding the FCFF vs. FCFE Framework
The foundational decision in any DCF analysis is selecting between Free Cash Flow to the Firm (FCFF) and Free Cash Flow to Equity (FCFE). This choice cascades through every subsequent modeling decision and materially impacts valuation outcomes.
Free Cash Flow to the Firm (FCFF) represents cash available to all capital providers—both debt and equity holders—before any financing decisions. The standard formulation is:
FCFF = EBIT × (1 - Tax Rate) + Depreciation & Amortization - Capital Expenditures - Increase in Net Working Capital
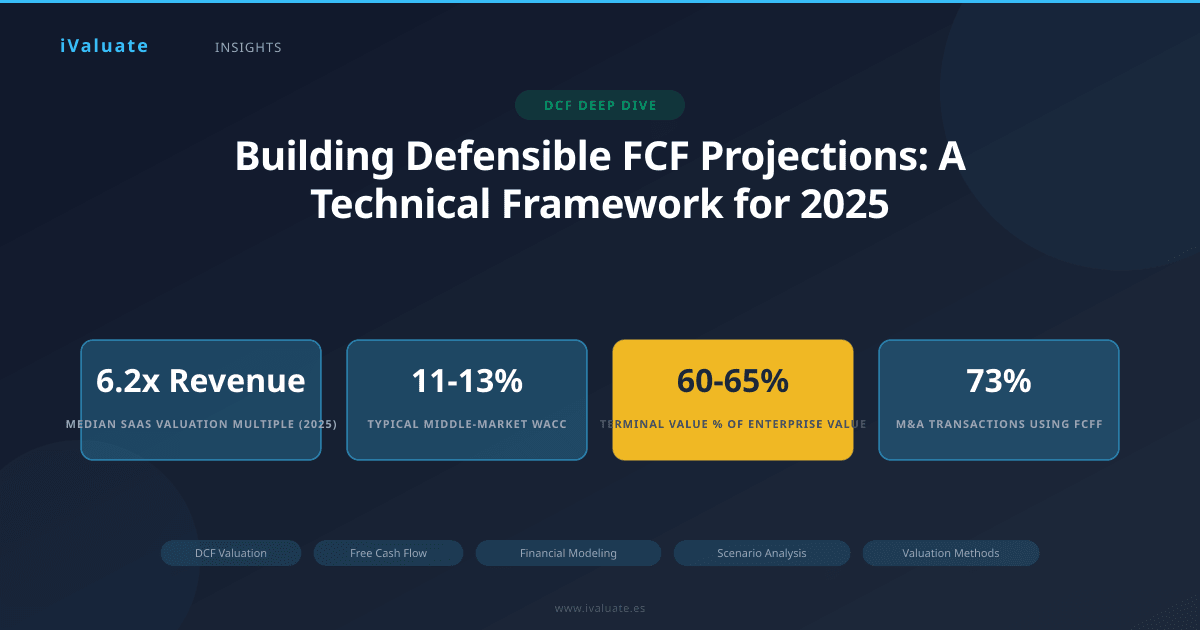
This approach is particularly appropriate when analyzing companies with changing capital structures, evaluating acquisition targets where the buyer will impose a new financing strategy, or when comparing companies across different leverage profiles. In 2025, approximately 73% of middle-market M&A transactions utilize FCFF-based valuations, according to recent PitchBook data.
Free Cash Flow to Equity (FCFE) measures cash available specifically to equity holders after all debt obligations:
FCFE = Net Income + Depreciation & Amortization - Capital Expenditures - Increase in Net Working Capital + Net Borrowing
FCFE is optimal for stable capital structures, dividend policy analysis, or situations where the existing debt profile will persist. Private equity firms typically employ FCFE when modeling portfolio company distributions, particularly in dividend recapitalization scenarios.
The choice between FCFF and FCFE isn't merely technical—it reflects fundamental assumptions about how the business will be financed and who bears the risk of capital structure decisions.
02 Architecting Revenue Drivers: Beyond Simple Growth Rates
The most common pitfall in FCF projections is oversimplified revenue modeling. A defensible projection disaggregates revenue into its constituent drivers, creating transparency and testability.
Volume-Price-Mix Decomposition
For product-based businesses, revenue should be modeled as:
Revenue = Units Sold × Average Selling Price × Product Mix Factor
Consider a SaaS company projecting 2025-2029 performance. Rather than applying a blanket 15% CAGR, a robust model would separately forecast:
- Net new customer additions: Derived from sales capacity (quota-carrying reps × average productivity) minus expected churn
- Average contract value: Influenced by pricing power, feature tier migration, and seat expansion
- Renewal rates: Segmented by customer cohort, with newer vintages typically exhibiting 85-90% gross retention versus 95%+ for mature cohorts
- Upsell/cross-sell penetration: Modeled as percentage of base expanding annually
In the current environment, where SaaS companies are trading at 6.2x forward revenue (down from 15x+ in 2021), investors demand this granularity. A 2024 analysis of 50 public SaaS companies revealed that those providing detailed unit economics commanded valuation premiums averaging 23% versus peers offering only aggregate guidance.
Market Share and TAM Dynamics
For growth-stage companies, revenue projections must reconcile with addressable market constraints. A credible model explicitly calculates:
Implied Market Share (Year 5) = Projected Revenue / (TAM × Serviceable Addressable Market %)
If your projections suggest capturing 40% market share in a fragmented industry where the current leader holds 12%, you've identified a red flag requiring either assumption revision or compelling strategic rationale. In 2025, with many technology sectors experiencing consolidation, realistic terminal share assumptions typically range from 8-15% in competitive markets.
03 Margin Expansion: The Physics of Profitability
Margin expansion assumptions require particular rigor because they compound revenue growth to produce exponential EBITDA effects. A company growing revenue 12% annually while expanding EBITDA margin from 18% to 28% over five years generates EBITDA CAGR of 24%—double the revenue growth rate.
Operating Leverage Mechanics
Defensible margin expansion models separately track:
- Gross margin evolution: Driven by economies of scale in production, supplier negotiations, or product mix shift toward higher-margin offerings
- Fixed cost absorption: As revenue scales, fixed costs (facilities, core technology infrastructure, base compensation) decline as a percentage of revenue
- Variable cost efficiency: Learning curves, process optimization, and automation driving per-unit cost reduction
A manufacturing company we analyzed in Q4 2024 projected gross margin expansion from 34% to 41% over five years. The defensible breakdown included:
- 2.5% from raw material procurement improvements (supported by signed long-term supplier agreements)
- 1.8% from production automation (capex already committed, ROI validated through pilot programs)
- 2.2% from product mix shift toward proprietary components (evidenced by R&D pipeline and customer pre-orders)
This granular approach proved far more credible than simply asserting "industry-standard margins" would be achieved.
The SG&A Scaling Question
Sales, general, and administrative expenses present a particular challenge. While conventional wisdom suggests SG&A should decline as a percentage of revenue, this assumption requires validation against:
- Sales model economics: High-touch enterprise sales may require SG&A to remain elevated at 35-40% of revenue even at scale
- Public company costs: If an exit to public markets is anticipated, add 150-200 basis points for SOX compliance, investor relations, and enhanced governance
- Geographic expansion: International growth often requires duplicative infrastructure, temporarily increasing SG&A intensity
Current market data suggests median SG&A as a percentage of revenue for profitable software companies stabilizes around 32-35%, regardless of scale—a sobering reality check for models projecting compression to 20%.
Margin expansion assumptions should be tied to specific operational initiatives with quantified impacts, not aspirational convergence to "peer benchmarks."
04 Capital Intensity and the Capex Conundrum
Capital expenditure projections often receive insufficient attention despite their material impact on free cash flow. The relationship between capex and revenue growth—capex intensity—varies dramatically by business model and growth stage.
Maintenance vs. Growth Capex
Rigorous models separately identify:
Maintenance capex: Investment required to sustain current revenue levels, typically modeled as a percentage of revenue or as depreciation plus inflation adjustment. For mature industrial companies, this often runs 2.5-4% of revenue.
Growth capex: Incremental investment enabling revenue expansion. This should be explicitly linked to capacity additions, with clear assumptions about:
- Revenue per unit of capacity (e.g., revenue per manufacturing line, per hotel room, per data center rack)
- Lead time between capex deployment and revenue generation
- Utilization ramp curves for new capacity
A distribution center expansion, for instance, might require $25M capex in Year 1, support $60M incremental revenue starting Year 2, and reach full $100M capacity utilization by Year 4. This temporal mismatch between investment and return must be explicitly modeled.
Asset-Light Transitions
Many companies are pursuing asset-light strategies, reducing capex intensity through outsourcing, cloud migration, or platform business models. When projecting such transitions:
- Model the transition period realistically—cloud migrations typically span 18-36 months with parallel infrastructure costs
- Account for one-time migration expenses (often capitalized but consuming cash)
- Adjust the cost structure to reflect higher operating expenses (cloud services, outsourcing fees) replacing capex
A retail client's cloud migration reduced annual capex from $12M to $3M but increased annual operating expenses by $7M—improving capital efficiency but with a more modest FCF impact than initially modeled.
05 Working Capital: The Hidden Cash Consumer
Changes in net working capital (NWC) represent one of the most commonly mismodeled elements of FCF projections. High-growth companies, in particular, often underestimate working capital consumption.
Component-Level Modeling
Rather than applying a simple "NWC as % of revenue" assumption, model the components:
- Days Sales Outstanding (DSO): Accounts receivable / (Revenue / 365). For B2B companies, 45-60 days is typical, but this varies by customer concentration and payment terms.
- Days Inventory Outstanding (DIO): Inventory / (COGS / 365). Manufacturing companies average 60-90 days; just-in-time operations may achieve 30-45 days.
- Days Payable Outstanding (DPO): Accounts payable / (COGS / 365). Larger companies often negotiate 60-90 day terms; smaller firms may face 30-day requirements.
The cash conversion cycle (DIO + DSO - DPO) provides a comprehensive metric. A company growing from $50M to $150M revenue with a 60-day cash conversion cycle will consume approximately $16M in incremental working capital over that growth period—cash that never appears on the income statement but materially impacts valuation.
Seasonal and Cyclical Considerations
For businesses with pronounced seasonality, annual average working capital masks significant intra-year cash demands. A toy manufacturer may require peak working capital 3x the annual average in Q3 as it builds inventory for holiday sales. This impacts:
- Required credit facility size and associated costs
- Cash flow timing and ability to service debt or pay dividends
- Risk profile and appropriate discount rates
In 2025, with short-term borrowing costs elevated, these seasonal dynamics carry greater significance than in the low-rate environment of 2020-2021.
06 Scenario Analysis: Quantifying Uncertainty
Single-point forecasts create false precision. Robust DCF analysis employs scenario modeling to bound the range of potential outcomes and identify key value drivers.
The Three-Scenario Framework
A standard approach develops Base, Upside, and Downside cases with probability-weighted outcomes:
Base Case (50-60% probability): Management's most likely scenario, incorporating reasonable assumptions about market conditions, competitive dynamics, and execution capability. This should represent the median outcome, not an aspirational target.
Upside Case (20-25% probability): Favorable scenario where 2-3 key assumptions break positively—faster market adoption, successful product launches, operational improvements exceeding targets. Revenue typically 20-30% above base case by Year 5.
Downside Case (20-25% probability): Adverse scenario reflecting competitive pressure, market headwinds, or execution challenges. Revenue typically 15-25% below base case, with margin compression from deleverage.
The probability-weighted valuation provides a more robust estimate than the base case alone. For a recent technology valuation, our scenario analysis produced:
- Base case: $285M enterprise value
- Upside case: $425M enterprise value (25% probability)
- Downside case: $180M enterprise value (20% probability)
- Probability-weighted: $281M enterprise value
The tight clustering around the base case validated our assumptions; significant divergence would have signaled the need for assumption refinement.
Stress Testing Key Assumptions
Beyond discrete scenarios, systematic stress testing identifies assumption sensitivity. For each key driver, model the valuation impact of ±10%, ±20% variance:
- Revenue growth rate (typically the highest impact variable)
- Terminal EBITDA margin
- Working capital intensity
- Capex as % of revenue
- WACC (discount rate)
- Terminal growth rate
A well-constructed sensitivity table might reveal that a 2% change in terminal EBITDA margin impacts valuation by 15%, while a 2% change in capex intensity affects valuation by only 4%. This guides where to focus diligence efforts and assumption refinement.
07 Sensitivity Testing: The Monte Carlo Advantage
For complex situations with multiple interacting variables, Monte Carlo simulation provides superior insight versus simple sensitivity tables.
Implementing Monte Carlo Analysis
Monte Carlo simulation runs thousands of iterations, randomly varying input assumptions within defined probability distributions to generate a valuation distribution. Key implementation steps:
- Identify variable inputs: Typically 8-12 key assumptions (revenue CAGR, margin expansion, capex intensity, terminal multiple, etc.)
- Define probability distributions: Normal distributions for most variables, triangular for bounded assumptions, lognormal for strictly positive variables like revenue growth
- Specify correlations: Revenue growth and margin expansion often correlate positively; revenue growth and working capital intensity typically correlate positively
- Run simulations: 10,000+ iterations to ensure statistical stability
- Analyze output distribution: Examine mean, median, standard deviation, and percentile ranges
A recent Monte Carlo analysis for a healthcare services company produced a valuation distribution with:
- Mean: $420M
- Median: $405M
- 25th percentile: $340M
- 75th percentile: $485M
- Standard deviation: $95M
This distribution informed negotiation strategy, with the buyer comfortable offering $380M (approximately 40th percentile) given identified execution risks.
Tornado Diagrams and Value Driver Identification
Tornado diagrams visually rank variables by their impact on valuation, calculated by varying each assumption independently while holding others constant. This identifies where analytical effort should concentrate and which assumptions warrant additional diligence.
In a typical middle-market DCF, the ranking often appears as:
- Revenue CAGR (Years 1-5): ±18% valuation impact
- Terminal EBITDA margin: ±14% valuation impact
- WACC: ±12% valuation impact
- Terminal growth rate: ±9% valuation impact
- Working capital intensity: ±6% valuation impact
- Capex intensity: ±5% valuation impact
This hierarchy guides resource allocation—spending three days refining capex assumptions that drive 5% valuation variance makes little sense when revenue assumptions driving 18% variance receive cursory treatment.
08 Building in Defensibility: Documentation and Audit Trail
A technically sound model becomes defensible through comprehensive documentation. Every material assumption should include:
- Source attribution: Management guidance, industry reports, historical analysis, or expert judgment
- Reconciliation to historical performance: If projecting 25% EBITDA margins when historical average is 18%, explicitly explain the operational changes driving improvement
- Peer benchmarking: Compare key metrics (growth rates, margins, capex intensity) to public comparables and explain variances
- Sensitivity disclosure: Transparently present how valuation changes with assumption modifications
In litigation contexts or fairness opinions, this documentation becomes critical. A 2024 Delaware Chancery Court decision explicitly criticized a valuation expert for "conclusory assumptions lacking evidentiary support"—a fate avoided through rigorous documentation.
09 The 2025-2026 Environment: Special Considerations
Current market conditions introduce specific challenges for FCF projections:
Inflation and Input Cost Volatility
With core PCE inflation running at 2.8% in early 2025, projections must address:
- Pricing power and ability to pass through cost increases
- Wage inflation (particularly for skilled labor, running 4-5% annually)
- Input cost hedging strategies and their P&L timing
Models should separately track nominal revenue growth (volume + price) versus real growth, ensuring margin assumptions reflect realistic cost dynamics.
Higher Cost of Capital
With WACC for middle-market companies averaging 11-13% (versus 8-10% in 2020-2021), the present value impact of out-year cash flows has diminished. This elevates the importance of near-term cash generation and reduces tolerance for extended J-curve investments.
Terminal value now represents 60-65% of total enterprise value in typical projections, down from 70-75% in the low-rate environment. This shifts analytical focus toward Years 1-5 assumption quality.
AI and Technology Disruption
Projections must grapple with AI-driven productivity and disruption. For knowledge-intensive businesses, credible models should address:
- Potential for AI-enabled margin expansion through automation
- Competitive dynamics as AI lowers barriers to entry in some sectors
- Required technology investment to maintain competitive parity
A professional services firm's 2025 projections incorporated 150 basis points of margin expansion from AI-assisted research and document generation, supported by pilot program results showing 22% productivity gains.
10 Practical Implementation: The Modeling Workflow
Translating these principles into practice requires a systematic workflow:
- Historical normalization (Week 1): Analyze 3-5 years of historical financials, adjust for non-recurring items, calculate normalized margins and returns
- Driver identification (Week 1): Decompose revenue and costs into constituent drivers, validate relationships through regression analysis
- Assumption development (Week 2): Build bottoms-up projections for each driver, benchmark against peers and industry data, document sources
- Model construction (Week 2): Build integrated financial statements (P&L, balance sheet, cash flow), ensure mathematical consistency and circular reference resolution
- Scenario development (Week 3): Create upside/downside cases, run sensitivity analyses, perform Monte Carlo simulation if warranted
- Validation and refinement (Week 3): Sanity-check outputs against market multiples, assess reasonableness of implied metrics, refine assumptions as needed
This timeline assumes a mid-sized company ($50-500M revenue) with moderate complexity. Larger, multi-segment businesses may require 6-8 weeks for comprehensive analysis.
11 Common Pitfalls and How to Avoid Them
Even experienced practitioners fall into predictable traps:
Hockey stick projections: Models showing minimal growth in Years 1-2 followed by explosive growth in Years 3-5 rarely reflect reality. If transformational growth is genuinely expected, it should begin manifesting in Year 1-2.
Ignoring the denominator: Focusing exclusively on cash flow numerators while neglecting discount rate implications. A 2% reduction in WACC often impacts valuation more than 10% revenue growth acceleration.
Terminal value dominance: If terminal value exceeds 75% of enterprise value, the projection period is likely too short or growth assumptions too conservative. Extend to capture more value in the explicit forecast period.
Circular reference paralysis: Interest expense depends on debt balance, which depends on cash flow, which depends on interest expense. Solve through iteration or use Excel's circular reference settings appropriately.
Precision theater: Projecting revenue to the nearest dollar five years forward creates false confidence. Round to meaningful precision (millions for large companies, thousands for small businesses).
12 The Path Forward: Technology-Enabled Rigor
As we progress through 2025-2026, the expectation for analytical rigor continues to intensify. Institutional investors, lenders, and acquirers demand comprehensive scenario analysis, transparent assumptions, and robust sensitivity testing as table stakes.
The good news: technology has democratized sophisticated analytical techniques previously available only to bulge-bracket banks. Cloud-based platforms now enable middle-market advisors to perform Monte Carlo simulations, maintain comprehensive assumption libraries, and generate institutional-quality output in a fraction of the time required even five years ago.
The most successful practitioners combine deep technical expertise with technological leverage. They understand the theoretical foundations—why FCFF and FCFE produce different values under certain capital structures, how operating leverage mechanics drive margin expansion, why working capital intensity varies by business model—but deploy technology to implement these concepts efficiently and consistently.
Professional platforms like iValuate have emerged to support this workflow, providing pre-built frameworks for scenario analysis, sensitivity testing, and assumption documentation while maintaining the flexibility required for complex situations. These tools don't replace professional judgment—they amplify it, allowing practitioners to focus analytical effort on the assumptions that truly drive value rather than spreadsheet mechanics.
As discount rates remain elevated and market participants maintain heightened scrutiny on cash generation, the ability to construct defensible, well-documented FCF projections with comprehensive scenario analysis has transitioned from differentiator to requirement. The frameworks outlined here—granular revenue driver modeling, evidence-based margin expansion, component-level working capital analysis, and systematic sensitivity testing—provide the foundation for valuations that withstand rigorous challenge and support confident decision-making in an uncertain environment.