Table of Contents10 sections
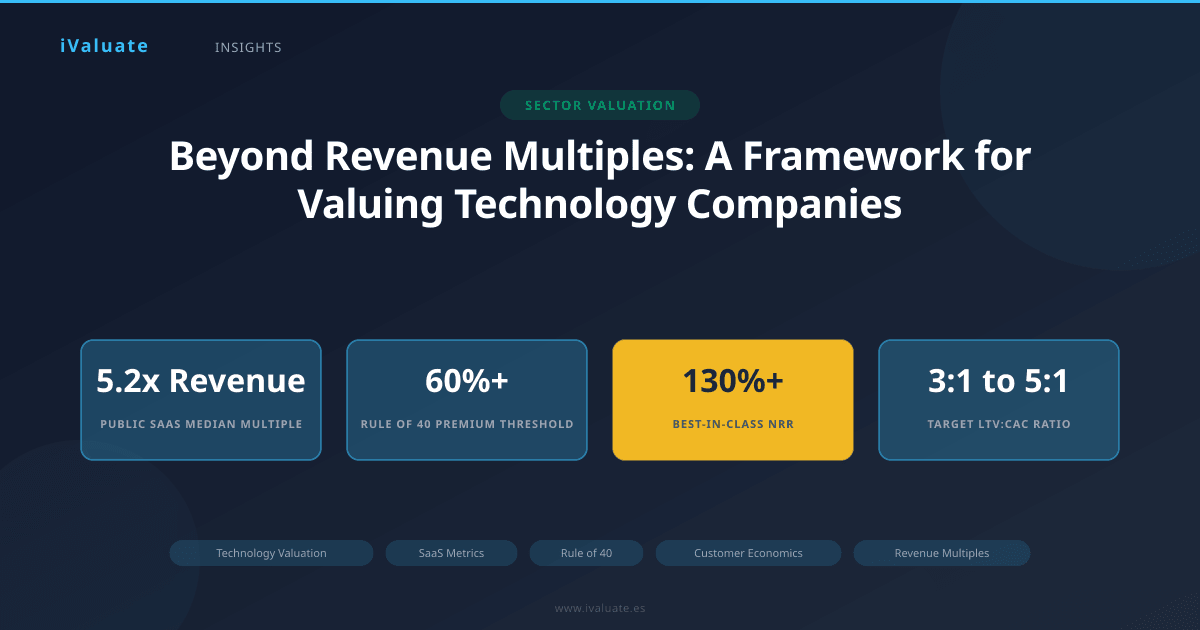
The technology sector has undergone a dramatic recalibration since the heady days of 2021, when revenue multiples for SaaS companies routinely exceeded 20x ARR and profitability was considered optional. As we navigate 2025-2026, the market has matured considerably. Public SaaS companies now trade at a median of 5.2x forward revenue—down from peaks of 12-15x—and investors have shifted decisively toward sustainable unit economics and capital efficiency.
This transformation demands a more sophisticated valuation framework. While revenue multiples remain a useful starting point, they capture only one dimension of value creation in technology companies. A comprehensive approach must integrate growth quality, profitability trajectories, customer economics, and competitive positioning to arrive at defensible valuations that withstand scrutiny in due diligence and reflect genuine enterprise value.
01 The Limitations of Revenue-Only Frameworks
Revenue multiples became the dominant shorthand for tech valuations during the 2010s growth era for understandable reasons: many high-growth software companies operated at losses while scaling, making EBITDA multiples impractical or negative. The implicit assumption was that revenue growth would eventually translate to profitability at scale, and that faster growth deserved premium valuations.
However, this framework creates several analytical blind spots:
- Growth quality variance: A company growing 50% year-over-year through heavy discounting and unsustainable customer acquisition costs deserves a different multiple than one achieving the same growth with strong unit economics
- Profitability pathway uncertainty: Revenue multiples provide no insight into whether a company can actually reach profitability, or at what margin levels
- Customer retention dynamics: Two companies with identical ARR may have vastly different customer cohort behaviors, churn rates, and lifetime value profiles
- Capital intensity differences: Not all revenue is created equal—some business models require continuous capital investment while others generate compounding returns
Consider two hypothetical $50 million ARR SaaS companies. Company A grows at 60% annually with a net revenue retention of 95% and burns $20 million per year. Company B grows at 40% with 120% net retention and is free cash flow positive. A pure revenue multiple approach might value Company A higher due to growth rate, but Company B's superior unit economics and self-sustaining model likely represent greater enterprise value.
02 The Rule of 40: Growth-Efficiency Integration
The Rule of 40 emerged as a critical framework for balancing growth and profitability in SaaS businesses. The principle states that a company's revenue growth rate plus its profit margin (typically free cash flow margin or EBITDA margin) should exceed 40%. A company growing at 50% can operate at -10% margins; one growing at 25% should achieve at least 15% margins.
As of Q1 2025, public SaaS companies demonstrate clear Rule of 40 stratification in valuations:
- Companies exceeding 60% (growth + margin) trade at median 7.8x forward revenue
- Companies in the 40-60% range trade at 5.1x forward revenue
- Companies below 40% trade at 3.2x forward revenue
- Companies below 20% trade at 1.8-2.5x forward revenue
This framework works because it captures the fundamental trade-off technology companies face: invest heavily for growth (sacrificing near-term margins) or optimize for profitability (potentially limiting growth). Companies that excel at both dimensions create disproportionate value.
The Rule of 40 provides a single, actionable metric that integrates the two primary value drivers in software businesses: the ability to grow and the ability to generate cash. Companies consistently above 40% demonstrate management teams that can execute on both dimensions simultaneously.
However, the Rule of 40 requires contextual application. Early-stage companies (sub-$10 million ARR) may reasonably operate below 40% while establishing product-market fit. Conversely, mature companies above $500 million ARR should typically exceed 50-60% to justify premium valuations, as their growth rates naturally moderate but margin expansion should accelerate.
03 Customer Unit Economics: The Foundation of Sustainable Value
Revenue multiples and even the Rule of 40 remain output metrics—they describe what's happening but not necessarily why or whether it's sustainable. Customer unit economics provide the foundational layer that explains value creation at the individual customer level.
Customer Acquisition Cost (CAC) and Payback Period
CAC represents the fully-loaded cost of acquiring a new customer, including sales and marketing expenses, sales team compensation, and allocated overhead. For SaaS companies in 2025, median CAC payback periods have compressed significantly:
- Best-in-class: 6-9 months
- Acceptable: 12-18 months
- Concerning: 24+ months
A company with 8-month CAC payback can reinvest cash from existing customers into new acquisition much faster than one requiring 20 months, creating a compounding growth advantage. This metric directly impacts how much capital a company requires to scale and whether growth is self-funding or perpetually dilutive.
Lifetime Value to CAC Ratio (LTV:CAC)
The LTV:CAC ratio measures the total gross profit expected from a customer relationship against the cost to acquire them. Current market benchmarks show:
- Exceptional: 5:1 or higher
- Strong: 3:1 to 5:1
- Acceptable: 2:1 to 3:1
- Problematic: Below 2:1
Calculating accurate LTV requires honest assessment of gross margin, churn rates, and customer lifetime. Many companies overestimate LTV by using overly optimistic churn assumptions or failing to account for gross margin erosion as they move upmarket or downmarket.
Net Revenue Retention (NRR)
NRR measures the revenue retained from existing customers over time, including expansion, contraction, and churn. It's arguably the single most important metric for SaaS valuation because it indicates whether the business compounds or decays at the customer level.
As of 2025, NRR stratification in public markets shows:
- 130%+ NRR: Premium valuations (8-12x revenue), indicates strong product-market fit and expansion potential
- 110-130% NRR: Above-average valuations (5-8x revenue), solid business with expansion
- 100-110% NRR: Market valuations (4-6x revenue), stable but limited expansion
- Below 100% NRR: Discounted valuations (2-4x revenue), indicates retention challenges
A company with 120% NRR grows its existing customer base by 20% annually without adding a single new customer. This creates a compounding foundation that dramatically reduces dependence on new customer acquisition and improves capital efficiency over time.
04 Cohort Analysis: Understanding Value Creation Over Time
Sophisticated technology valuations require cohort-level analysis to understand how customer economics evolve. This involves tracking groups of customers acquired in specific periods and measuring their behavior over subsequent years.
A 2024 analysis of a mid-market SaaS company illustrates this approach. The company showed 45% year-over-year revenue growth and operated at -5% EBITDA margins, yielding a Rule of 40 score of 40%—seemingly acceptable. However, cohort analysis revealed concerning dynamics:
- 2021 customer cohort: Year 1 ACV of $50,000, Year 3 ACV of $42,000 (16% contraction)
- 2022 customer cohort: Year 1 ACV of $48,000, Year 2 ACV of $44,000 (8% contraction)
- 2023 customer cohort: Year 1 ACV of $52,000, insufficient data for retention analysis
The headline growth rate masked deteriorating cohort economics. Older customers were contracting, meaning growth depended entirely on new customer acquisition—a fundamentally weaker position than if existing customers were expanding. This insight led to a 35% valuation discount versus the initial revenue multiple approach.
Conversely, a different company with 35% growth but strong cohort expansion (2021 cohort at 145% of original ACV by Year 3) commanded a premium valuation despite slower headline growth, because the business demonstrated compounding value at the customer level.
05 Market Position and Competitive Moats
Technology markets often exhibit winner-take-most dynamics, where the leading platform captures disproportionate value. Valuation frameworks must assess competitive positioning and the durability of advantages.
Network Effects and Switching Costs
Companies with strong network effects—where value increases as more users join—or high switching costs justify premium valuations because they possess structural moats. Examples include:
- Direct network effects: Communication platforms where each additional user makes the platform more valuable to all users
- Data network effects: Machine learning platforms that improve with more data, creating self-reinforcing advantages
- Integration switching costs: Enterprise software deeply embedded in workflows, where replacement requires significant organizational change
A 2025 valuation of a vertical SaaS platform serving commercial real estate demonstrated this principle. Despite growing at only 28% annually, the platform had achieved 73% market penetration in its niche and exhibited 118% NRR. The combination of market dominance and high switching costs (average implementation required 6-9 months and integration with 12+ systems) supported a 9.2x revenue multiple—nearly double the median for its growth rate—because competitive displacement was structurally difficult.
Total Addressable Market and Penetration
Growth potential depends on both current execution and remaining market opportunity. A company with $30 million ARR growing 50% annually looks different if it has captured 40% of a $100 million TAM versus 2% of a $5 billion TAM.
Sophisticated TAM analysis moves beyond top-down market sizing to bottom-up assessment:
- Number of potential customers in addressable segments
- Average contract value based on customer size and use case
- Realistic penetration rates given sales capacity and competitive dynamics
- Adjacent market expansion opportunities
06 Integrating Multiple Frameworks: A Comprehensive Approach
Professional technology valuations synthesize these dimensions into a coherent assessment. The process typically follows this structure:
Step 1: Baseline Revenue Multiple Analysis
Establish a starting point using comparable public companies and recent M&A transactions in similar segments. As of Q1 2025, baseline multiples by category include:
- Infrastructure/DevOps SaaS: 6.2x forward revenue (median)
- Vertical SaaS: 5.8x forward revenue
- Horizontal productivity: 4.9x forward revenue
- Consumer subscription tech: 3.1x forward revenue
Step 2: Rule of 40 Adjustment
Apply a multiplier based on the company's Rule of 40 score relative to comparables. Companies 20+ points above their segment median typically warrant 30-50% valuation premiums; those 20+ points below face similar discounts.
Step 3: Customer Economics Assessment
Adjust for unit economics quality:
- LTV:CAC above 4:1 and CAC payback under 12 months: +15-25% premium
- NRR above 120%: +20-30% premium
- Cohort analysis showing acceleration: +10-20% premium
- Conversely, weak unit economics (LTV:CAC below 2:1, NRR below 100%, deteriorating cohorts) warrant 25-40% discounts
Step 4: Competitive Position and Moat Analysis
Assess market position and durability:
- Category leadership with network effects: +25-40% premium
- Strong market position (top 3) with switching costs: +10-20% premium
- Fragmented market with limited differentiation: -15-25% discount
- Losing market share or facing existential competitive threats: -30-50% discount
Step 5: Growth Sustainability and TAM
Evaluate whether current growth rates are sustainable and how much runway remains:
- Large TAM (10x+ current revenue) with proven go-to-market efficiency: +15-25% premium
- Moderate TAM (3-5x current revenue) with clear expansion path: Neutral to +10%
- Limited TAM (less than 2x current revenue) or decelerating growth: -20-35% discount
The most defensible technology valuations don't rely on a single metric but rather integrate multiple perspectives—growth efficiency, customer economics, competitive positioning, and market opportunity—into a comprehensive assessment that reflects the full complexity of value creation in software businesses.
07 Case Study: Applying the Comprehensive Framework
Consider a real-world application (details anonymized) of this framework to a B2B SaaS company in the workflow automation space:
Company Profile (2025):
- ARR: $85 million
- Growth rate: 42% YoY
- Free cash flow margin: -8%
- Rule of 40 score: 34%
Initial Assessment: Based purely on revenue multiples for workflow SaaS (median 5.1x), the company would be valued at approximately $434 million.
Customer Economics Deep Dive:
- CAC payback: 14 months (acceptable but not exceptional)
- LTV:CAC: 3.2:1 (solid)
- NRR: 108% (moderate expansion)
- Cohort analysis: Stable retention but limited expansion in mature cohorts
Competitive Assessment:
- Market position: #4 player in a fragmented market
- Differentiation: Moderate—strong in specific vertical but not category-defining
- TAM: $2.3 billion with 3.7% current penetration
Valuation Synthesis:
- Baseline: 5.1x × $85M = $434M
- Rule of 40 adjustment: -10% (below segment median of 42%)
- Customer economics: -5% (acceptable but not premium metrics)
- Competitive position: -8% (mid-tier player without strong moat)
- Growth sustainability: +5% (large TAM provides runway)
Final Valuation Range: $355-385 million (4.2-4.5x ARR), representing an 18% discount to the naive revenue multiple approach. This adjustment reflected the company's solid but unexceptional execution across multiple dimensions—adequate for a strategic acquisition but not commanding a premium valuation.
The buyer in this transaction ultimately acquired the company at $368 million (4.3x ARR), validating the comprehensive framework's output and avoiding the overpayment that would have resulted from applying median multiples without adjustment for company-specific factors.
08 The Evolution Toward Profitability-Weighted Frameworks
As the technology sector matures, we're witnessing a gradual shift toward profitability-weighted valuation frameworks that more closely resemble traditional industrial company approaches—but adapted for software economics.
Leading private equity firms now routinely apply hybrid methodologies that blend revenue multiples for the growth component with EBITDA or free cash flow multiples for the profitable portion of the business. For a company with $100 million revenue, $20 million EBITDA, and 30% growth:
- Growth component: 30% × $100M = $30M growth revenue valued at 8x = $240M
- Profitable base: $20M EBITDA valued at 15x = $300M
- Combined enterprise value: $540M (5.4x revenue, 27x EBITDA)
This approach explicitly values both growth potential and current cash generation, providing a more nuanced assessment than either metric alone. It particularly suits later-stage technology companies transitioning from pure growth to balanced growth-profitability models.
09 Special Considerations for Different Technology Segments
Infrastructure and Developer Tools
Infrastructure companies often exhibit different economics than application-layer SaaS. They typically have:
- Higher gross margins (75-85% vs. 70-75% for typical SaaS)
- Lower churn but also lower expansion rates
- Consumption-based pricing creating revenue volatility
- Winner-take-most dynamics favoring category leaders
Valuation frameworks should weight market position and technical moat more heavily, as infrastructure markets tend toward consolidation around 2-3 dominant platforms.
Vertical SaaS
Vertical SaaS companies serving specific industries warrant specialized assessment:
- TAM is inherently limited but penetration can be very high
- Switching costs are often elevated due to industry-specific workflows
- Expansion through adjacent products and services (payments, financing, marketplace) drives long-term value
- Market leadership position is critical—#1 player often captures 50%+ of value
Consumer Subscription Technology
Consumer-facing subscription businesses face different dynamics:
- Much higher churn rates (5-10% monthly vs. 1-2% annually for B2B)
- Lower revenue per user but larger addressable markets
- Cohort analysis is absolutely critical—unit economics must work at scale
- Brand and product differentiation drive retention and pricing power
10 Looking Forward: Technology Valuation in 2025-2026
The technology valuation landscape continues to evolve as the sector matures. Several trends are shaping current practice:
AI-driven business model transformation: Companies successfully integrating AI to improve unit economics (lower CAC, higher NRR, better gross margins through automation) are commanding 20-30% premiums as the market recognizes sustainable competitive advantages from AI implementation.
Profitability requirement hardening: The era of profitless growth has definitively ended. Companies unable to demonstrate a clear path to positive unit economics within 18-24 months face severe valuation compression, regardless of growth rates.
Public-private valuation convergence: The gap between private and public market valuations has narrowed significantly. Private companies can no longer assume 20-30% premiums to public comparables; in many cases, private valuations now track at modest discounts due to liquidity differences.
Customer concentration risk: Investors are scrutinizing customer concentration more carefully. Companies with >20% revenue from any single customer or >40% from top 5 customers face meaningful valuation discounts (15-25%) reflecting key customer risk.
For corporate development teams, private equity investors, and business owners navigating this environment, the imperative is clear: comprehensive, multi-dimensional valuation frameworks are no longer optional but essential for making sound investment decisions and achieving successful exits.
The companies that command premium valuations in 2025-2026 share common characteristics: they demonstrate strong Rule of 40 performance, exhibit excellent customer unit economics with high NRR, maintain defensible competitive positions, and operate in markets with substantial remaining opportunity. Revenue growth alone—once sufficient to justify premium multiples—now represents merely one input into a sophisticated analytical framework.
Professional valuation platforms like iValuate have evolved to support this comprehensive approach, enabling practitioners to efficiently integrate multiple analytical dimensions—from customer cohort analysis to competitive benchmarking to scenario modeling—into defensible valuation conclusions. As technology companies continue to mature and investors demand greater analytical rigor, the ability to move beyond simple revenue multiples toward integrated, multi-factor frameworks will increasingly separate sophisticated practitioners from those relying on outdated rules of thumb.
The technology sector's valuation methodology has fundamentally shifted from growth-at-any-cost toward sustainable, efficient value creation. Those who adapt their analytical frameworks accordingly will make better investment decisions, achieve more successful exits, and allocate capital more effectively in an increasingly sophisticated market.