Table of Contents10 sections
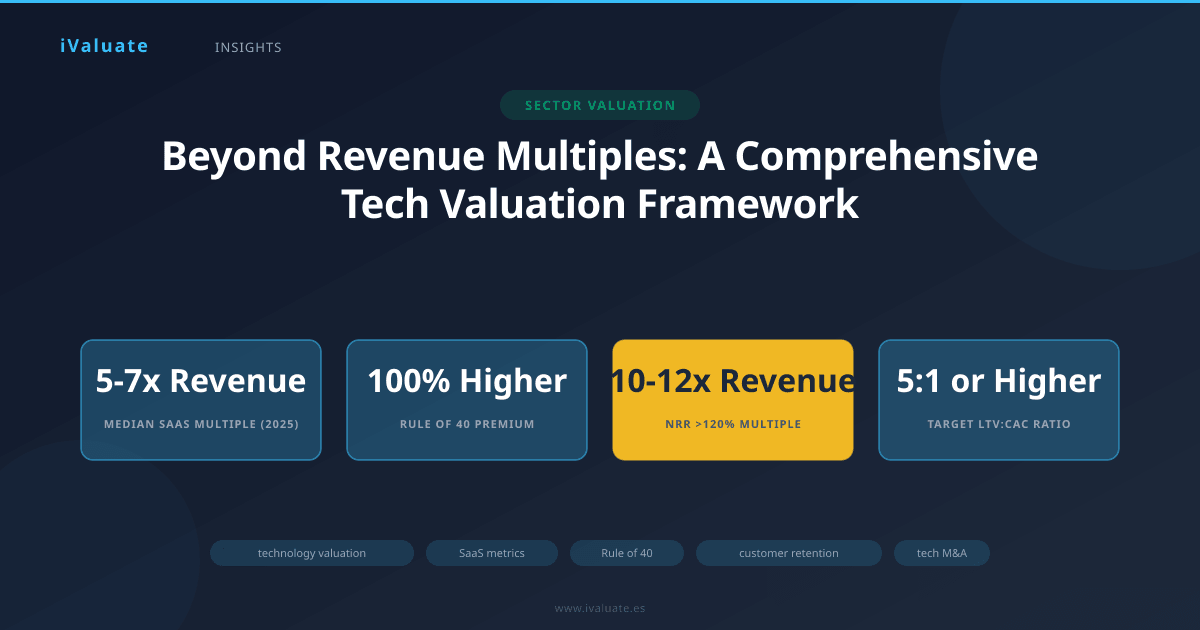
The technology sector has undergone a dramatic valuation reset since the exuberance of 2021, when SaaS companies routinely traded at 15-20x forward revenue. By early 2025, median public SaaS multiples have compressed to 5-7x revenue, forcing both investors and operators to adopt more sophisticated valuation frameworks that look beyond simple top-line metrics. For private technology companies seeking exits or capital raises, understanding these comprehensive approaches has become essential to achieving optimal valuations.
The reality is that revenue multiples, while convenient, mask critical differences in business quality, growth sustainability, and profitability potential. Two software companies with identical revenue growth rates can—and should—command vastly different valuations based on factors like customer retention, unit economics, market positioning, and capital efficiency. This article explores the multi-dimensional frameworks that sophisticated buyers and investors now employ when valuing technology companies.
01 The Evolution of Tech Valuation: From Growth-at-All-Costs to Efficient Growth
The shift in technology valuation methodology reflects broader market maturation. During the 2010-2021 period, cheap capital and the "land grab" mentality meant that revenue growth often trumped all other considerations. Companies burning significant cash to acquire customers were rewarded with premium valuations, operating under the assumption that scale would eventually translate to profitability.
The 2022-2024 correction fundamentally altered this calculus. Rising interest rates increased the discount applied to future cash flows, while public market volatility made the path to liquidity less certain. By 2025, the market has settled into a new equilibrium that values efficient growth—companies that can demonstrate both expansion and a clear path to sustainable profitability.
This evolution is quantifiable. Analysis of 150+ public SaaS companies shows that the correlation between revenue growth and valuation multiple has weakened from 0.78 in 2021 to 0.52 in 2025, while the correlation between free cash flow margin and valuation multiple has strengthened from 0.41 to 0.69 over the same period. The market is sending a clear signal: profitability matters.
02 The Rule of 40: Foundation of Modern SaaS Valuation
No discussion of technology company valuation is complete without addressing the Rule of 40, which has evolved from a rough heuristic to a foundational metric in SaaS valuation. The rule states that a company's revenue growth rate plus its profit margin (typically EBITDA or free cash flow margin) should equal or exceed 40%.
For example, a company growing at 30% annually with a 15% EBITDA margin achieves a Rule of 40 score of 45%, indicating strong overall performance. Conversely, a company growing at 50% but losing 20% of revenue to negative EBITDA scores only 30%, suggesting unsustainable unit economics despite impressive top-line growth.
Why the Rule of 40 Matters
The Rule of 40 works because it captures the fundamental trade-off in software businesses: companies can invest heavily in growth (sacrificing near-term profitability) or optimize for margins (sacrificing growth), but the best businesses excel at both. Data from 2025 shows that public SaaS companies exceeding the Rule of 40 trade at a median 8.2x forward revenue, compared to just 4.1x for those below the threshold—a 100% valuation premium.
For private companies, this framework provides crucial guidance on resource allocation. A Series B SaaS company growing at 80% might justify significant losses in pursuit of market leadership, achieving a Rule of 40 score through growth alone. However, a mature company growing at 20% must demonstrate 20%+ margins to meet the threshold and command premium valuations.
The Rule of 40 has become the single most predictive metric for SaaS valuations in the current market environment, with companies above the threshold commanding consistent premiums across all growth rates and sizes.
Beyond the Basics: Weighted Rule of 40
Sophisticated investors now apply weighted versions of the Rule of 40 that adjust for company maturity and market conditions. For high-growth companies (>40% revenue growth), some frameworks weight growth more heavily (60/40 split), recognizing that rapid expansion in large markets justifies near-term losses. Conversely, for slower-growth companies (<20%), profitability might be weighted more heavily (40/60 split), reflecting the market's expectation that mature companies should generate cash.
03 Customer Metrics: The Leading Indicators of Valuation
While the Rule of 40 provides a snapshot of current performance, customer metrics offer predictive insight into future performance and sustainability. These metrics have become central to technology company due diligence and valuation work.
Net Revenue Retention (NRR)
Net Revenue Retention measures the percentage of revenue retained from existing customers over a period, including expansions, upsells, and cross-sells, minus churn and downgrades. An NRR of 120% means that even with zero new customer acquisition, the company would grow revenue by 20% annually from its existing base.
NRR has emerged as perhaps the single most important metric in SaaS valuation. Companies with NRR above 120% trade at median multiples of 10-12x forward revenue in the current market, compared to 5-6x for companies with NRR below 110%. This premium reflects the compounding power of a strong customer base and the reduced customer acquisition costs required to achieve growth targets.
A real-world example: In a 2024 private equity transaction, a marketing automation SaaS company with 35% revenue growth and 125% NRR commanded a 9.5x revenue multiple, while a competitor with 40% growth but only 105% NRR received just 6.2x revenue. The difference? The first company's growth was largely organic and capital-efficient, while the second required continuous heavy investment in new customer acquisition.
Customer Acquisition Cost (CAC) and Payback Period
CAC measures the fully-loaded cost of acquiring a new customer, including sales, marketing, and related overhead. The CAC payback period—the time required to recover acquisition costs through gross margin—provides crucial insight into capital efficiency.
Best-in-class SaaS companies achieve CAC payback periods of 12 months or less, meaning they recover their customer acquisition investment within a year. Companies with payback periods exceeding 24 months face significant valuation pressure, as they require substantial capital to fuel growth and face heightened risk if growth slows or market conditions deteriorate.
In 2025, the median CAC payback period for public SaaS companies is approximately 16 months, up from 14 months in 2021. This extension reflects both increased competition for customers and the general tightening of marketing efficiency. Companies that have maintained or improved their payback periods during this challenging environment command meaningful valuation premiums.
Lifetime Value to CAC Ratio (LTV:CAC)
The LTV:CAC ratio compares the total expected lifetime value of a customer to the cost of acquiring that customer. A ratio of 3:1 is generally considered the minimum threshold for a healthy SaaS business, with ratios of 5:1 or higher indicating exceptional unit economics.
This metric integrates multiple aspects of business quality: customer retention (which drives LTV), gross margins (which determine how much of revenue converts to profit), and sales efficiency (which determines CAC). Companies with LTV:CAC ratios above 5:1 can justify premium valuations because they demonstrate the ability to profitably scale—every dollar invested in customer acquisition returns five dollars in lifetime value.
04 Cohort Analysis: Understanding Business Quality Over Time
Static metrics provide snapshots, but cohort analysis reveals trends that are critical to valuation. By tracking groups of customers acquired in specific periods, analysts can assess whether unit economics are improving or deteriorating, whether product-market fit is strengthening, and whether growth is sustainable.
A cohort analysis might reveal, for example, that customers acquired in 2023 have 15% higher NRR than those acquired in 2022, suggesting improving product stickiness and expansion potential. Alternatively, it might show that newer cohorts have longer payback periods, indicating increasing customer acquisition costs or declining pricing power.
In a 2025 transaction involving a vertical SaaS company serving healthcare providers, cohort analysis proved decisive to valuation. While headline metrics showed 40% growth and strong overall retention, deeper analysis revealed that cohorts acquired in the past 18 months had significantly lower retention and expansion rates than earlier cohorts. This suggested that the company had exhausted its core market and was moving downmarket to maintain growth—a red flag that reduced the final valuation by approximately 20% from initial expectations.
05 Market Position and Competitive Dynamics
Beyond financial and customer metrics, a company's market position fundamentally influences valuation. Technology markets often exhibit winner-take-most dynamics, where the leading player captures disproportionate value. Understanding where a company sits in its competitive landscape is essential to defensible valuation.
Market Leadership Premium
Category leaders typically command 30-50% valuation premiums over fast-followers, even with comparable financial metrics. This premium reflects several factors: pricing power, customer preference, talent attraction, and the optionality to expand into adjacent markets from a position of strength.
A company with 25% market share in a defined category will generally receive a higher multiple than one with 5% share, assuming similar growth and profitability. The leader has demonstrated product-market fit at scale, established brand recognition, and created switching costs that protect revenue streams.
Total Addressable Market (TAM) and Market Penetration
The size and growth rate of the addressable market directly impact valuation by defining the ceiling for future growth. A company with $50 million in revenue and a $10 billion TAM has far more expansion potential than one facing a $500 million TAM, even if current growth rates are identical.
Equally important is market penetration. A company that has captured 20% of its TAM faces natural growth constraints and may need to expand into adjacent markets to maintain momentum. One that has captured just 2% has a long runway for organic growth within its core market. In the current environment, companies with less than 5% market penetration in large, growing TAMs command premium valuations, as they can sustain high growth rates without requiring risky market expansion.
06 Technology Stack and Product Architecture
The underlying technology and product architecture of a software company increasingly factor into valuation, particularly for strategic acquirers. Modern, cloud-native architectures built on scalable infrastructure command premiums over legacy systems requiring significant technical debt remediation.
Key considerations include:
- Scalability: Can the platform handle 10x current usage without fundamental re-architecture?
- API-first design: Does the product integrate easily with other systems, enabling ecosystem partnerships?
- Multi-tenancy: Is the architecture efficient for serving many customers from shared infrastructure?
- Security and compliance: Does the platform meet enterprise requirements for data protection and regulatory compliance?
- Technical debt: What level of ongoing investment is required to maintain and modernize the codebase?
In a notable 2024 example, a cybersecurity software company with modest growth (25% annually) commanded a 12x revenue multiple in a strategic acquisition, well above market norms. The premium was justified by the company's modern, API-first architecture that could be easily integrated into the acquirer's existing product suite, creating immediate cross-sell opportunities across a large customer base.
07 Building a Comprehensive Valuation Framework
Sophisticated technology company valuation integrates multiple methodologies and metrics into a holistic framework. Rather than relying on a single multiple or metric, best practice involves triangulating value through several approaches:
1. Comparable Company Analysis with Adjustments
Start with revenue multiples from comparable public companies, but adjust for differences in growth, profitability, and business quality. A company growing at 40% with 120% NRR should trade at a premium to the median multiple for companies growing at 40%, reflecting superior unit economics.
2. Discounted Cash Flow with Scenario Analysis
Build detailed DCF models that project free cash flow over 10+ years, using customer metrics and cohort data to ground assumptions. Run multiple scenarios (base case, upside, downside) to understand valuation sensitivity to key drivers like retention rates, expansion rates, and customer acquisition costs.
3. Precedent Transaction Analysis
Examine recent M&A transactions for comparable companies, adjusting for market conditions and deal-specific factors. In 2025, private SaaS companies are typically transacting at 60-75% of public company multiples, reflecting illiquidity discounts and the current M&A environment.
4. Strategic Value Assessment
For companies with strategic acquirers, assess potential synergies and strategic value. A company that provides a strategic acquirer with access to a new customer segment, geographic market, or product capability may command a significant premium over financial buyer valuations.
The most defensible valuations emerge from frameworks that weight multiple methodologies, with particular emphasis on metrics that predict future performance rather than simply describing past results.
08 Sector-Specific Considerations
While the frameworks described above apply broadly to technology companies, certain sectors have unique characteristics that influence valuation:
Infrastructure and Developer Tools
Companies selling to developers or providing infrastructure services often exhibit different metrics than application-layer SaaS. Usage-based pricing models mean that revenue can be more volatile but also scales more naturally with customer success. These companies are typically valued on a blend of revenue multiples and consumption metrics, with particular focus on net dollar retention among high-usage customers.
Vertical SaaS
Software companies serving specific industries (healthcare, financial services, construction, etc.) often command premium valuations due to deep domain expertise, high switching costs, and the ability to expand into adjacent services like payments, lending, or insurance. Vertical SaaS companies with 100%+ NRR and embedded fintech capabilities have traded at 10-15x revenue even in the current environment.
Marketplaces and Platforms
Two-sided marketplaces and platform businesses require different frameworks, as traditional SaaS metrics may not apply. Key metrics include gross merchandise value (GMV), take rate, liquidity (the probability of a transaction), and network effects. Established marketplaces with strong network effects can command premium valuations despite lower growth rates, as their competitive moats are exceptionally durable.
09 The Path Forward: Valuation in an AI-Driven World
As we move deeper into 2025 and beyond, artificial intelligence is reshaping technology company valuation in several ways. Companies that have successfully integrated AI to improve unit economics—reducing CAC, improving retention, or enhancing product value—are seeing valuation premiums of 15-25% over peers with comparable financial metrics but less advanced AI capabilities.
However, the market has also become more discerning about AI claims. Simply adding AI features or rebranding existing products as "AI-powered" no longer commands premiums. Instead, investors and acquirers are focused on companies where AI demonstrably improves core business metrics: faster customer onboarding, higher expansion rates, lower churn, or reduced customer support costs.
The valuation frameworks described in this article remain relevant in an AI-driven world, but with additional layers of analysis around data assets, model performance, and the sustainability of AI-driven competitive advantages. Companies that can demonstrate durable AI-powered improvements to customer metrics and unit economics will command the highest valuations in the coming years.
10 Conclusion: From Art to Science
Technology company valuation has evolved from a relatively simple exercise in applying revenue multiples to a sophisticated, multi-dimensional analysis that integrates financial performance, customer metrics, market position, and strategic considerations. The companies that command premium valuations in 2025 are those that excel across multiple dimensions: efficient growth (Rule of 40), exceptional customer economics (high NRR, strong LTV:CAC ratios), market leadership, and modern technology architecture.
For business owners and executives preparing for a transaction or capital raise, the implication is clear: focus on the metrics that sophisticated buyers value most. Improving NRR by 10 percentage points or reducing CAC payback by three months can have a more significant impact on valuation than incremental improvements in revenue growth. Understanding these frameworks allows management teams to make strategic decisions that maximize long-term enterprise value.
Professional valuation platforms like iValuate have become essential tools for advisors and investors conducting this type of comprehensive analysis, enabling rapid benchmarking against comparable companies and integration of multiple valuation methodologies. As the technology sector continues to mature and valuation frameworks become increasingly sophisticated, the ability to efficiently analyze companies across these multiple dimensions will separate leading advisory practices from those relying on outdated, single-metric approaches.
The technology companies that thrive in the current environment will be those that understand these frameworks and align their strategies accordingly—building businesses that don't just grow quickly, but grow efficiently, retain customers exceptionally well, and create sustainable competitive advantages that translate to premium valuations when the time comes to realize value.