Table of Contents10 sections
Asset-based lending (ABL) has emerged as a critical financing tool for middle-market companies navigating the elevated interest rate environment of 2025-2026. Unlike cash flow lending, which relies primarily on enterprise earnings, ABL facilities are secured by specific collateral pools—typically accounts receivable, inventory, and equipment. The valuation of these assets determines both the availability of credit and the advance rates lenders will extend, making collateral appraisal a cornerstone of ABL underwriting.
For CFOs, restructuring advisors, and private equity sponsors, understanding how lenders value ABL collateral is essential for optimizing capital structure, navigating distressed situations, and maximizing borrowing capacity. This article provides a comprehensive technical framework for valuing the three primary ABL collateral categories, examining the methodologies, advance rate determinants, and market dynamics shaping ABL facilities in today's environment.
01 The ABL Market Landscape in 2025-2026
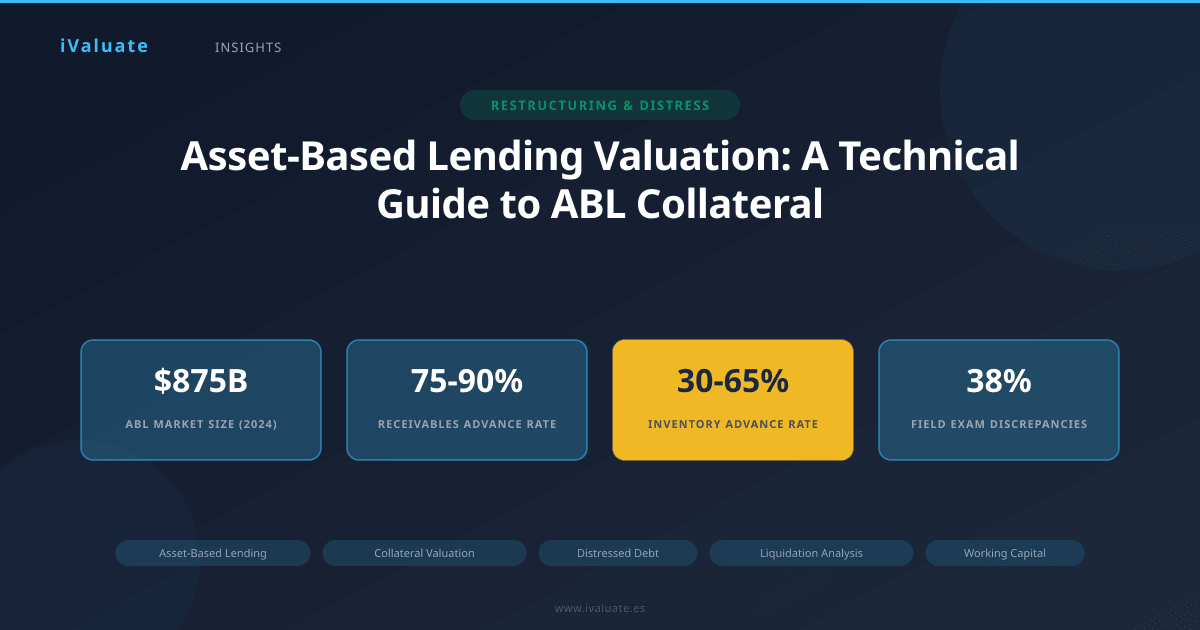
The ABL market has experienced significant growth as traditional cash flow lending has contracted amid economic uncertainty. According to recent industry data, ABL commitments in the United States reached approximately $875 billion in 2024, representing a 12% increase from the prior year. This growth reflects several converging factors: elevated interest rates making cash flow coverage more challenging, increased covenant-lite term loan defaults requiring asset-secured rescue financing, and a flight to quality among lenders seeking tangible collateral protection.
The median ABL facility size for middle-market companies currently ranges from $15 million to $150 million, with advance rates varying significantly based on collateral quality, industry sector, and borrower financial health. In the current environment, lenders have become increasingly conservative in their collateral valuations, particularly for inventory and equipment, as concerns about potential recession and supply chain disruptions persist.
02 Accounts Receivable Valuation: The Foundation of ABL
Accounts receivable typically represent the most liquid and reliable component of an ABL borrowing base, often commanding the highest advance rates. The valuation process for receivables extends beyond simple face value analysis to encompass detailed quality assessment and collectability analysis.
Eligibility Criteria and Quality Assessment
Not all receivables qualify for ABL borrowing base calculations. Lenders apply rigorous eligibility criteria to identify which receivables merit inclusion. Standard exclusions include:
- Receivables outstanding beyond 90 days from invoice date
- Amounts owed by affiliates or related parties
- Receivables subject to customer disputes or chargebacks
- Concentration exposures exceeding defined thresholds (typically 15-25% to any single account debtor)
- Foreign receivables without appropriate credit insurance
- Contra-accounts or bill-and-hold arrangements
- Government receivables requiring special assignment procedures
The eligible receivables balance forms the foundation for the borrowing base calculation. In 2025, lenders are conducting more frequent borrowing base certifications—often weekly or bi-weekly for stressed borrowers—to monitor collateral quality in real-time.
Advance Rate Determination
Advance rates on eligible receivables typically range from 75% to 90%, with the specific rate reflecting multiple risk factors. High-quality receivables from investment-grade customers with consistent payment histories command advance rates at the upper end of this range. Conversely, receivables from lower-rated customers, longer payment terms, or industries experiencing stress may warrant advance rates of 70% or below.
The advance rate calculation incorporates several analytical components:
- Historical dilution analysis: Measuring the percentage reduction in receivables due to credits, discounts, returns, and allowances over a rolling 12-month period. Typical dilution rates range from 2% to 8%, with the lender's advance rate reduced accordingly.
- Concentration risk adjustments: Applying sublimits to prevent over-reliance on any single customer. A borrower with 30% of receivables from one customer might face a 15% concentration cap, effectively reducing the advance rate on excess exposure to zero.
- Cross-aging analysis: Evaluating the aging profile of receivables to identify deterioration trends. A receivables portfolio with 15% of balances in the 61-90 day bucket signals collection challenges that warrant advance rate reductions.
- Industry-specific risk factors: Certain sectors face structural challenges affecting collectability. Retail receivables in 2025, for example, often carry lower advance rates due to elevated bankruptcy risk among retailers.
A middle-market distributor with $25 million in accounts receivable might have only $20 million in eligible receivables after applying eligibility criteria, with an 85% advance rate yielding $17 million in borrowing capacity. If dilution increases from 3% to 6%, the lender may reduce the advance rate to 82%, decreasing availability by $600,000—a material impact on liquidity.
Orderly vs. Forced Liquidation Considerations
While receivables valuations in ongoing operations focus on collectability, distressed situations require liquidation value analysis. In an orderly liquidation scenario, where the lender has 90-180 days to collect receivables, recovery rates typically range from 80% to 90% of eligible balances. Forced liquidation scenarios, with compressed 30-60 day timeframes, generally yield 60% to 75% recovery rates due to the need for factoring arrangements or bulk sale discounts.
These liquidation assumptions directly inform advance rates. A lender targeting a 1.5x liquidation coverage ratio on a forced liquidation basis might limit the advance rate to 67% (100% ÷ 1.5) even on high-quality receivables, building in a substantial cushion for downside scenarios.
03 Inventory Valuation: Complexity and Risk
Inventory represents the most challenging ABL collateral category to value, given its heterogeneity, obsolescence risk, and market-dependent liquidation values. Advance rates on inventory typically range from 30% to 65%, significantly lower than receivables, reflecting these inherent risks.
Inventory Classification and Valuation Methodologies
Effective inventory valuation begins with detailed classification. ABL lenders distinguish between:
- Raw materials: Generally the most liquid inventory category, particularly for commoditized inputs with established markets. Advance rates of 50-65% are common for high-quality raw materials.
- Work-in-process (WIP): Partially completed goods with limited alternative use. WIP typically receives advance rates of 0-25%, and many lenders exclude it entirely from the borrowing base.
- Finished goods: Completed products ready for sale. Advance rates vary widely (25-60%) based on product shelf life, market demand, and brand strength.
- Spare parts and supplies: Often excluded or subject to minimal advance rates (0-15%) due to limited marketability.
The valuation methodology for inventory in ABL contexts differs fundamentally from GAAP book value. Lenders focus on net orderly liquidation value (NOLV) or forced liquidation value (FLV), not historical cost or replacement value. This requires engaging qualified appraisers who specialize in inventory liquidation analysis.
Appraisal-Based Advance Rates
Professional inventory appraisals form the cornerstone of ABL inventory valuations. Appraisers employ several methodologies:
Market comparison approach: Analyzing recent liquidation sales of comparable inventory to establish recovery rate benchmarks. In 2025, liquidation recovery rates for general merchandise have compressed to 25-35% of cost due to excess retail inventory across many categories.
Cost-to-reproduce approach: Estimating the cost to replace inventory, then applying appropriate discounts for condition, obsolescence, and liquidation expenses. This approach works well for commodity raw materials.
Income approach: For specialized finished goods, appraisers may estimate net proceeds from an orderly sale process, incorporating marketing time, holding costs, and selling expenses.
A typical appraisal report will provide both NOLV (assuming 4-6 months to liquidate) and FLV (assuming 60-90 days). The spread between these values can be substantial—often 20-40 percentage points. For example, electronic components might appraise at 55% NOLV but only 35% FLV due to rapid technological obsolescence.
Inventory Advance Rate Determinants
Beyond appraisal values, several factors influence inventory advance rates:
- Turnover velocity: Inventory turning 8-12 times annually demonstrates strong demand and commands higher advance rates than slow-moving inventory turning 2-3 times yearly.
- Perishability and obsolescence risk: Fashion apparel, with seasonal obsolescence, typically receives 25-35% advance rates, while industrial fasteners might achieve 50-60%.
- Concentration and fungibility: Diverse inventory with broad market appeal supports higher advance rates than specialized inventory dependent on specific customer requirements.
- Location and control: Inventory in borrower-controlled facilities with robust perpetual inventory systems receives better treatment than inventory in third-party warehouses or consignment locations.
- Regulatory and environmental considerations: Inventory subject to special handling requirements or disposal regulations faces advance rate penalties.
Consider a food distributor with $40 million in inventory at cost. An appraisal might establish 65% NOLV for shelf-stable products but only 30% for refrigerated items with 30-day shelf life. If the lender applies a 75% advance rate to NOLV for shelf-stable inventory ($20 million × 65% × 75% = $9.75 million) and 50% to NOLV for perishables ($20 million × 30% × 50% = $3 million), total inventory availability reaches $12.75 million—just 32% of book value.
Inventory Monitoring and Field Examinations
Unlike receivables, which generate regular cash collections providing validation, inventory requires physical verification. ABL lenders conduct field examinations at least annually, and quarterly or monthly for higher-risk borrowers. These examinations verify:
- Physical existence and condition of inventory
- Accuracy of perpetual inventory records versus physical counts
- Proper classification of inventory categories
- Identification of obsolete, damaged, or slow-moving items
- Compliance with inventory eligibility criteria
Field examination findings frequently result in borrowing base reductions. A 2024 industry survey found that 38% of field examinations identified material discrepancies requiring borrowing base adjustments, with an average reduction of 12% from reported levels.
04 Equipment Valuation: Technical Complexity and Market Dynamics
Equipment and machinery represent the third major ABL collateral category, characterized by highly specialized valuation requirements and significant market volatility. Equipment advance rates typically range from 40% to 75% of orderly liquidation value, with substantial variation based on equipment type, age, and market conditions.
Equipment Appraisal Methodologies
Equipment valuation requires specialized appraisers with industry-specific expertise. The appraisal process typically generates multiple value conclusions:
Fair market value (FMV): The price at which equipment would change hands between a willing buyer and seller, both having reasonable knowledge of relevant facts, neither under compulsion. FMV assumes adequate marketing time and normal market conditions.
Orderly liquidation value (OLV): The gross amount expressed in cash that could be realized from a liquidation sale, given a reasonable period to find a purchaser, with the seller compelled to sell on an as-is, where-is basis. OLV typically ranges from 50% to 75% of FMV, depending on equipment type and market depth.
Forced liquidation value (FLV): The gross amount expressed in cash that could be realized from a properly advertised and conducted public auction, with the seller compelled to sell with a sense of immediacy on an as-is, where-is basis. FLV typically represents 40% to 60% of OLV, or 25% to 45% of FMV.
For ABL purposes, lenders focus primarily on OLV and FLV, as these represent realistic recovery scenarios in default situations.
Equipment-Specific Valuation Considerations
Equipment valuation complexity varies dramatically by asset type:
General-purpose equipment: Forklifts, pallet jacks, and standard office equipment have deep secondary markets and command higher advance rates (60-75% of OLV). A 2025 appraisal of Toyota forklifts might show FMV of $35,000, OLV of $24,500 (70%), and FLV of $14,700 (42% of FMV).
Industry-specific machinery: Specialized manufacturing equipment faces narrower markets. A custom injection molding machine might appraise at FMV of $500,000, OLV of $225,000 (45%), and FLV of $112,500 (22.5% of FMV), warranting advance rates of only 40-50% of OLV.
Technology and software: Rapid obsolescence severely limits equipment value. Enterprise software systems and IT infrastructure typically receive minimal advance rates (0-25% of OLV) or exclusion from borrowing bases entirely.
Rolling stock and vehicles: Trucks, trailers, and delivery vehicles benefit from established wholesale markets. Late-model commercial trucks might achieve 65-70% of FMV in OLV scenarios, supporting advance rates of 60-70% of OLV.
Market Conditions and Equipment Values in 2025-2026
Equipment values have experienced significant volatility in the current market environment. Several trends are shaping equipment valuations:
- Supply chain normalization: After severe shortages in 2021-2023, equipment availability has improved, compressing used equipment values by 15-25% across many categories since peak levels.
- Energy transition impacts: Traditional combustion engine equipment faces declining values as buyers anticipate regulatory changes, while electric alternatives command premiums despite limited secondary markets.
- Technology disruption: Automation and AI integration are accelerating obsolescence of manual equipment, particularly in warehousing and logistics sectors.
- Interest rate sensitivity: Higher financing costs have reduced buyer appetite for used equipment, extending liquidation timelines and compressing recovery rates.
These dynamics have prompted lenders to reduce equipment advance rates by 5-10 percentage points compared to 2022 levels, and to require more frequent reappraisals—often annually rather than the traditional 2-3 year cycle.
Equipment Advance Rate Determinants
Beyond appraisal values, lenders consider multiple factors when establishing equipment advance rates:
- Age and condition: Equipment under 5 years old with documented maintenance receives favorable treatment; equipment over 10 years faces significant discounts.
- Portability and installation costs: Easily movable equipment commands higher advance rates than equipment requiring specialized rigging and reinstallation.
- Title and lien perfection: Equipment subject to certificate of title requirements (vehicles) or requiring fixture filing analysis introduces perfection risk that may reduce advance rates.
- Cross-border considerations: Equipment located in foreign jurisdictions or subject to export restrictions receives reduced advance rates or exclusion.
- Environmental and regulatory compliance: Equipment requiring specialized disposal or containing hazardous materials faces advance rate penalties.
A manufacturing company with $15 million in equipment at book value might receive an appraisal showing $8.5 million OLV and $5.1 million FLV. If the lender applies a 65% advance rate to OLV, equipment availability reaches $5.525 million. However, if $3 million of specialized equipment is excluded due to narrow market appeal, and another $2 million is subject to a reduced 50% advance rate due to age, actual availability might fall to $3.9 million—just 26% of book value.
05 Integrated Borrowing Base Management
Effective ABL collateral valuation requires integrated analysis across all collateral categories. The total borrowing base represents the sum of availability from receivables, inventory, and equipment, subject to various sublimits and reserves.
Reserves and Availability Blocks
Beyond advance rate calculations, lenders impose reserves that reduce availability:
- Rent and landlord lien reserves: Typically 3-6 months of rent for locations housing collateral, protecting against landlord liens.
- Sales tax reserves: Accrued but unpaid sales taxes, which often have priority over lender liens.
- Customer deposit reserves: Prepayments from customers that may require refund in bankruptcy.
- Professional fee reserves: Estimated costs of field examinations, appraisals, and potential workout expenses.
- Dilution reserves: Additional cushion beyond historical dilution if trends are deteriorating.
These reserves can reduce availability by 10-25% of the calculated borrowing base, representing a material consideration in facility sizing.
Borrowing Base Certificates and Compliance
Borrowers must submit borrowing base certificates on a regular schedule—weekly, bi-weekly, or monthly depending on credit quality. These certificates detail eligible collateral balances, apply advance rates, and calculate availability. Lenders verify certificate accuracy through field examinations and accounts receivable aging reviews.
Borrowing base covenant violations occur when outstanding loans exceed availability. In 2025, approximately 22% of middle-market ABL borrowers have experienced at least one borrowing base violation, often triggering default interest rates, increased monitoring, and potential facility restructuring.
06 Case Study: Multi-Category Collateral Valuation
Consider a $75 million revenue distribution company seeking a $30 million ABL facility in early 2025:
Accounts Receivable: $18 million gross receivables, with $15 million eligible after removing aged balances, affiliates, and concentrated exposures. Historical dilution of 4%. Lender applies 85% advance rate: $15M × 85% = $12.75M availability.
Inventory: $22 million at cost, appraised at $13.2M NOLV (60% of cost). Lender applies 60% advance rate to NOLV: $13.2M × 60% = $7.92M availability.
Equipment: $8 million book value, appraised at $4.8M OLV (60% of book value). Lender applies 65% advance rate to OLV: $4.8M × 65% = $3.12M availability.
Gross availability: $23.79M
Less reserves: Rent reserve ($750K), sales tax reserve ($400K), professional fees ($150K), dilution reserve ($300K) = $1.6M total reserves.
Net availability: $22.19M
The company sought $30 million but receives a $22 million commitment based on collateral values—a 27% shortfall requiring alternative capital sources or operational adjustments to reduce working capital needs.
07 Distressed Situations and Liquidation Analysis
When borrowers face financial distress, ABL collateral valuation shifts from going-concern advance rates to liquidation recovery analysis. Lenders must assess whether collateral values provide adequate protection for outstanding loans.
Liquidation Timelines and Recovery Rates
The distinction between orderly and forced liquidation becomes critical in distressed scenarios:
Orderly liquidation assumes 90-180 days for receivables collection, 120-180 days for inventory disposition through going-out-of-business sales or wholesale channels, and 90-180 days for equipment sales through specialized auctions or brokers. Recovery rates typically reach 75-85% of advance rates for receivables, 60-75% for inventory, and 70-85% for equipment.
Forced liquidation assumes compressed 30-90 day timelines, requiring bulk sales, factoring arrangements, or emergency auctions. Recovery rates often fall to 55-70% of advance rates for receivables, 40-60% for inventory, and 50-70% for equipment.
In 2024-2025, several high-profile retail bankruptcies demonstrated the importance of conservative liquidation assumptions. One national retailer with $120 million in inventory at cost achieved only 22% recovery through going-out-of-business sales—well below the 35% FLV appraisal, as store closing sales coincided with broader retail distress and excess industry inventory.
Intercreditor Dynamics
Many middle-market companies maintain both ABL facilities and term loan or bond debt, creating complex intercreditor relationships. ABL lenders typically hold first-priority liens on working capital assets (receivables and inventory) and second-priority liens on fixed assets, while term lenders hold first-priority liens on fixed assets and second-priority liens on working capital.
These intercreditor arrangements affect collateral valuation in distressed situations. If equipment values decline below term loan balances, the ABL lender's second lien position becomes worthless, effectively eliminating equipment from the ABL borrowing base. This dynamic has become more prevalent in 2025 as equipment values have compressed while term loan balances remain elevated.
08 Technology and ABL Collateral Monitoring
The ABL industry has embraced technology to enhance collateral monitoring and valuation accuracy. Modern ABL platforms integrate with borrower ERP systems to provide real-time visibility into receivables aging, inventory levels, and collateral quality metrics.
Advanced analytics enable lenders to identify early warning signals: deteriorating receivables aging, increasing inventory levels relative to sales, concentration creep, or dilution trend changes. These tools allow proactive borrowing base adjustments before significant value erosion occurs.
Artificial intelligence and machine learning applications are emerging to predict receivables collectability, identify inventory obsolescence risk, and estimate equipment values between formal appraisals. While these technologies supplement rather than replace traditional appraisals and field examinations, they enhance monitoring frequency and accuracy.
09 Regulatory and Accounting Considerations
ABL collateral valuation intersects with several regulatory and accounting frameworks. Under ASC 820 (Fair Value Measurement), lenders must value collateral securing impaired loans at fair value, which may differ from liquidation values used for advance rate purposes. This creates potential tension between lending and accounting valuations.
Bank regulators scrutinize ABL collateral valuations through examination processes, focusing on appraisal quality, advance rate justification, and reserve adequacy. The OCC's 2023 guidance on commercial real estate and asset-based lending emphasized the importance of independent appraisals, appropriate advance rates reflecting current market conditions, and robust collateral monitoring.
For borrowers, ABL facility terms affect financial statement presentation. Borrowing base limitations may result in classification of portions of ABL facilities as long-term debt if availability constraints prevent repayment within 12 months, impacting working capital ratios and covenant compliance.
10 Looking Forward: ABL Collateral Valuation in an Uncertain Environment
As we progress through 2025-2026, several trends will shape ABL collateral valuation practices:
Continued conservatism: Economic uncertainty and potential recession risk will maintain pressure on advance rates and appraisal values. Lenders are unlikely to relax underwriting standards until sustained economic stability emerges.
Increased monitoring intensity: More frequent borrowing base certifications, field examinations, and appraisals will become standard, particularly for borrowers in stressed sectors or showing performance deterioration.
Industry-specific challenges: Certain sectors face structural headwinds affecting collateral values. Retail inventory, fossil fuel equipment, and commercial real estate-related assets warrant particular scrutiny.
Technology integration: Continued advancement in collateral monitoring technology will enable more dynamic, real-time borrowing base management, potentially allowing higher advance rates for borrowers with superior systems and transparency.
ESG considerations: Environmental, social, and governance factors increasingly influence equipment values and inventory marketability, requiring integration into valuation frameworks.
For financial professionals navigating ABL facilities, whether as borrowers, lenders, or advisors, mastering collateral valuation methodologies remains essential. The technical complexity of advance rate determination, the importance of professional appraisals, and the dynamic nature of collateral values require sophisticated analytical capabilities.
Professional valuation platforms like iValuate provide the analytical infrastructure to support these complex assessments, enabling CFOs and advisors to model borrowing base scenarios, stress-test collateral values under various assumptions, and optimize capital structure decisions. As ABL facilities continue to play a central role in middle-market financing, the ability to accurately value and monitor collateral will remain a critical competency for financial professionals across the capital structure spectrum.