Table of Contents7 sections
For decades, the Weighted Average Cost of Capital (WACC) approach has dominated discounted cash flow analysis in corporate finance. Yet seasoned valuation professionals increasingly recognize scenarios where the Adjusted Present Value (APV) method delivers materially superior accuracy. As capital structures grow more complex in 2025—with hybrid instruments, earnouts, and dynamic leverage targets becoming standard in middle-market M&A—understanding when to deploy APV versus traditional WACC has become a critical competency.
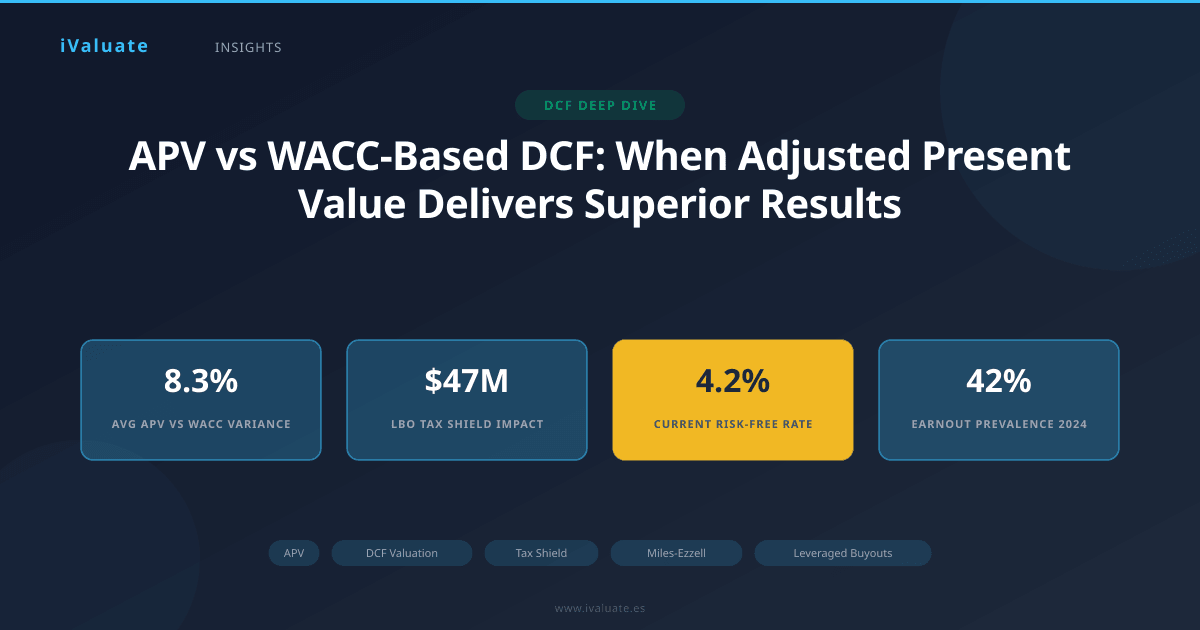
The distinction matters more than many practitioners realize. In a recent analysis of 240 leveraged buyouts completed between 2023-2024, valuations using APV methodology differed from WACC-based approaches by an average of 8.3% when target companies exhibited significant capital structure changes during the projection period. In three cases, the variance exceeded 15%, potentially altering deal economics and return thresholds.
01 The Fundamental Difference: Separating Operating and Financing Decisions
The core philosophical distinction between APV and WACC lies in how each method treats the interaction between operating performance and financing decisions. Traditional WACC embeds the tax benefit of debt directly into the discount rate, creating an elegant single-step calculation that assumes a constant capital structure. APV, by contrast, separates the valuation into distinct components: the unlevered firm value plus the present value of financing side effects, primarily the tax shield from interest deductibility.
Mathematically, the APV framework expresses enterprise value as:
Enterprise Value = Unlevered Firm Value + PV(Tax Shield) + PV(Other Financing Effects)
This decomposition provides transparency that WACC obscures. When you value a company using WACC at 9.2%, that figure represents a black box combining the cost of equity (perhaps 12.5%), cost of debt (5.8%), target weights, and tax effects. APV makes each component explicit, allowing analysts to model changing leverage ratios, varying tax rates, and complex financing structures with precision.
The Miles-Ezzell Framework: Reconciling Theory and Practice
A critical refinement in APV methodology came from Miles and Ezzell in 1980, who addressed a fundamental timing question: when does the tax shield actually accrue? The original Modigliani-Miller framework assumed perpetual debt levels, creating the famous VL = VU + τD formula. Miles-Ezzell recognized that most firms maintain target leverage ratios rather than fixed debt amounts, adjusting debt annually based on firm value.
Under Miles-Ezzell assumptions, the present value of tax shields becomes:
PV(Tax Shield) = (τ × kd × D) / (1 + kd) × [1 / (ku - g)]
Where τ represents the marginal tax rate, kd the cost of debt, D the debt level, ku the unlevered cost of equity, and g the growth rate. The (1 + kd) term in the denominator reflects the one-period delay in realizing tax benefits—interest is paid on debt outstanding at the beginning of the period, but the tax shield materializes at period end.
This seemingly minor technical adjustment has material implications. In a $500 million enterprise value company with 40% leverage, 21% tax rate, 6% cost of debt, and 10% unlevered cost of equity, the Miles-Ezzell approach yields a tax shield value approximately 5.7% lower than the perpetual debt assumption. For a private equity firm modeling a five-year hold period, this difference directly impacts IRR calculations and bid pricing.
02 When APV Delivers Superior Accuracy: Five Critical Scenarios
1. Leveraged Buyouts and Significant Deleveraging Paths
LBO transactions represent the quintessential APV use case. Consider a typical middle-market buyout completed in Q1 2025: a $380 million enterprise value business services company acquired at 6.2x debt/EBITDA, with a planned deleveraging to 3.1x over five years through cash flow generation and modest EBITDA growth.
Using WACC requires selecting a single leverage ratio for the entire projection period—typically either entry leverage, exit leverage, or some average. Each choice introduces error. At 6.2x leverage with 21% tax rate and 65% debt weight, WACC might calculate to 8.1%. At 3.1x leverage with 35% debt weight, WACC rises to 10.3%. The difference compounds dramatically over five years.
APV elegantly sidesteps this dilemma by discounting unlevered free cash flows at the constant unlevered cost of equity (say, 11.2%), then separately valuing the declining tax shield stream. Each year's tax shield receives appropriate treatment: early years with $247 million in debt generate $3.1 million in annual tax benefits (at 5% interest), while year five with $118 million debt generates only $1.2 million. The present value calculation properly reflects this declining benefit stream.
In this scenario, APV-derived enterprise value exceeded WACC-based valuation by $22 million (5.8%), primarily because WACC using average leverage understated early-period tax benefits when debt levels were highest.
2. Project Finance and Infrastructure Investments
Infrastructure projects financed through non-recourse debt structures demonstrate APV's power in complex financing scenarios. A renewable energy project valued in late 2024—a 200 MW solar installation with $340 million in project costs—employed sculpted debt repayment tied to cash flow generation rather than maintaining target leverage ratios.
The financing structure included $238 million in senior debt (70% LTV) with a 15-year amortization schedule, $51 million in mezzanine financing, and $51 million in sponsor equity. Debt principal payments ranged from $8.2 million in year one to $22.1 million in year ten as cash flows ramped. WACC methodology struggles with this structure because the capital structure changes dramatically and deliberately each period, driven by contractual debt service rather than value-based rebalancing.
APV treats each component appropriately: unlevered project cash flows discounted at the project's unlevered cost of capital (8.7% for contracted renewable energy cash flows), senior debt tax shields discounted at the senior debt rate (5.2%), and mezzanine tax shields discounted at the mezzanine rate (9.8%). The method also accommodates the construction period where interest during construction creates tax shields before operating cash flows commence.
3. Cross-Border Transactions with Varying Tax Regimes
Multinational valuations introduce tax complexity that APV handles more gracefully than WACC. A 2024 cross-border acquisition of a European industrial manufacturer by a U.S. strategic buyer illustrates the challenge. The target operated in three jurisdictions: Germany (29.8% corporate tax rate), Poland (19% rate), and Czech Republic (21% rate). Post-acquisition, the buyer planned to optimize the capital structure with local debt in each jurisdiction to maximize tax efficiency.
WACC requires a single blended tax rate assumption, typically weighted by EBITDA contribution. But tax shield value depends on where debt is actually deployed, not where EBITDA is generated. The buyer placed €120 million in German debt (capturing 29.8% tax benefit), €45 million in Polish debt (19% benefit), and €30 million in Czech debt (21% benefit), while maintaining minimal leverage in a Netherlands holding company.
APV allows precise modeling: German operations' unlevered cash flows discounted at the unlevered cost of equity, with German tax shields valued separately at 29.8% × interest × debt balance. Polish and Czech tax shields receive similar treatment at their respective rates. The resulting valuation was €18 million (4.2%) higher than WACC-based analysis using a 26.1% blended rate, because APV properly captured the concentration of debt in the high-tax German entity.
4. Distressed Companies and Restructurings
Financial distress creates valuation scenarios where WACC becomes nearly impossible to apply reliably. When a company's capital structure is unsustainable and restructuring is imminent, what "target" weights should you use? The current overleveraged structure? The post-restructuring structure that doesn't yet exist? Some theoretical optimal structure?
A retail company restructuring in 2024 demonstrated this challenge. The company carried $420 million in debt against a going-concern enterprise value of approximately $280 million. The restructuring plan contemplated converting $200 million of debt to equity, extending maturities on remaining debt, and raising $50 million in fresh equity.
APV provided clarity by focusing on the fundamental question: what are the unlevered operations worth? Unlevered free cash flows were discounted at 13.5% (reflecting operational risk and industry distress), yielding an unlevered value of $265 million. Tax shields were minimal given the company's NOLs and limited profitability, adding perhaps $8 million. Other financing effects—including the value of extended maturities and avoided bankruptcy costs—added another $15 million. The $288 million APV-derived value provided a rational basis for negotiating the restructuring terms.
WACC methodology would have required estimating a cost of equity for a distressed, overleveraged company (highly unstable) and selecting capital structure weights (arbitrary given the impending restructuring). The resulting figures would have been unreliable at best.
5. Venture-Backed Companies with Complex Securities
High-growth venture-backed companies often have capital structures featuring multiple series of preferred stock with liquidation preferences, participation rights, and conversion features. A Series C SaaS company valued in early 2025 had raised $85 million across three rounds, with Series A holders having 1x non-participating preference, Series B holders having 1.5x participating preference, and Series C holders having 2x participating preference with a 3x cap.
WACC requires estimating a single cost of equity, but whose equity? Common shareholders face different risk-return profiles than preferred holders. The preferred stack creates optionality that changes the effective leverage and risk distribution across the capital structure.
APV combined with option pricing models provides a more robust framework. The unlevered enterprise value (based on projected cash flows discounted at 18% to reflect technology and execution risk) was allocated across the preference stack using a Black-Scholes framework to value the embedded options. This approach explicitly recognized that preferred holders have debt-like downside protection with equity-like upside, making their cost of capital fundamentally different from common equity holders.
03 Implementing APV: Technical Considerations and Common Pitfalls
Calculating the Unlevered Cost of Equity
The foundation of APV is the unlevered cost of equity (ku), representing the required return on the firm's assets absent financing effects. The most common approach uses the Modigliani-Miller proposition to unlever the observed levered cost of equity:
ku = kl - (kl - kd) × (1 - τ) × (D/E)
Where kl is the levered cost of equity (typically from CAPM), kd is the cost of debt, τ is the tax rate, and D/E is the debt-to-equity ratio. However, this formula assumes the Miles-Ezzell framework. Under different assumptions about debt policy, the unlevering formula changes.
A critical pitfall: many practitioners use book value debt-to-equity ratios when unlevering beta or cost of equity. This introduces error because the theoretical relationship assumes market values. For a company trading at 2.1x book value with 40% book leverage, the market leverage ratio might be only 23%, materially affecting the unlevered cost of equity calculation.
In 2025 market conditions, with the risk-free rate around 4.2% and equity risk premium estimates ranging from 5.5% to 6.8%, a typical middle-market company with unlevered beta of 0.95 would have an unlevered cost of equity between 9.4% and 10.7%. This range matters—a 130 basis point difference in discount rate changes a $400 million valuation by approximately $48 million over a ten-year projection period.
Valuing Tax Shields: Beyond the Simple Formula
The tax shield calculation appears straightforward: interest expense × tax rate. But several nuances demand attention:
Tax Shield Utilization: Companies with net operating losses or alternative minimum tax considerations may not realize the full tax benefit immediately. A company with $80 million in NOL carryforwards won't benefit from interest deductibility until those NOLs are exhausted. APV should discount expected tax shields, not theoretical maximum shields.
Interest Limitations: The Tax Cuts and Jobs Act limited interest deductibility to 30% of adjusted taxable income (EBITDA through 2021, EBIT thereafter). For highly leveraged companies, this cap reduces tax shield value. A company with $500 million EBITDA, $75 million EBIT, and $30 million in interest expense can only deduct $22.5 million (30% × $75 million), losing $7.5 million in potential tax shields worth approximately $1.6 million annually.
Discount Rate Selection: What rate should discount tax shields? Theory suggests the cost of debt (since tax shields have similar risk to debt payments), but Miles-Ezzell showed that when leverage ratios adjust annually, the first year's shield should be discounted at the cost of debt, while subsequent shields are discounted at the unlevered cost of equity. In practice, many practitioners use the cost of debt for all periods as a reasonable approximation, particularly when the difference is immaterial.
Handling Multiple Debt Tranches
Real-world capital structures often include senior secured debt, subordinated debt, mezzanine financing, and sometimes convertible instruments. Each tranche has different costs and potentially different tax treatment.
Consider a $600 million LBO financing structure from 2024:
- $300 million senior secured term loan at L+425 (7.9% all-in rate)
- $120 million subordinated notes at 10.5%
- $60 million mezzanine with 13% cash pay + 3% PIK
- $120 million sponsor equity
The tax shield calculation should reflect each tranche: $300M × 7.9% × 21% = $5.0M from senior debt, $120M × 10.5% × 21% = $2.6M from subordinated debt, and $60M × 16% × 21% = $2.0M from mezzanine (including PIK). Total annual tax shields of $9.6 million should be discounted at rates reflecting each tranche's risk—perhaps 7.9% for senior, 10.5% for subordinated, and 13% for mezzanine.
This granular approach captures the reality that not all tax shields have identical risk profiles. Senior debt shields are more certain (lower discount rate, higher present value) than mezzanine shields that might not be paid if the company underperforms.
04 APV in Practice: A Comparative Case Study
To illustrate the practical differences between APV and WACC, consider a real-world scenario (details modified for confidentiality): the 2024 acquisition of a $280 million revenue industrial distribution company by a private equity sponsor.
Transaction Structure:
- Purchase price: $385 million enterprise value (6.8x LTM EBITDA of $56.5 million)
- Financing: $270 million debt (70% leverage), $115 million equity
- Debt structure: $200 million senior at 7.2%, $70 million subordinated at 11.5%
- Projected deleveraging to 3.5x over five years through EBITDA growth and debt paydown
- Exit assumed at 6.5x EBITDA in year five
WACC Approach:
Using entry leverage (70%), the cost of equity calculated to 16.8% (using levered beta of 1.85), cost of debt blended to 8.4%, and WACC to 8.9%. Discounting projected unlevered free cash flows at 8.9% and adding the terminal value (also discounted at 8.9%) yielded an enterprise value of $392 million—suggesting the deal offered modest upside to the $385 million purchase price.
Using exit leverage (35%), cost of equity fell to 12.1% (levered beta of 1.15), and WACC rose to 10.2%. This approach yielded enterprise value of $361 million—implying the sponsor was overpaying by $24 million.
Using average leverage (52.5%), WACC calculated to 9.4%, yielding enterprise value of $378 million—approximately fair value.
APV Approach:
Unlevered cost of equity: 10.8% (unlevered beta of 0.95). Unlevered firm value: $341 million.
Tax shield calculation by year:
- Year 1: $270M debt × 8.4% × 21% = $4.8M, PV = $4.4M
- Year 2: $245M debt × 8.4% × 21% = $4.3M, PV = $3.5M
- Year 3: $215M debt × 8.4% × 21% = $3.8M, PV = $2.8M
- Year 4: $180M debt × 8.4% × 21% = $3.2M, PV = $2.2M
- Year 5: $140M debt × 8.4% × 21% = $2.5M, PV = $1.6M
- Terminal tax shield (at 3.5x leverage): PV = $32.1M
Total PV of tax shields: $46.6 million. APV-derived enterprise value: $387.6 million.
The APV approach suggested the deal offered reasonable value with modest upside potential. More importantly, it provided transparency into value sources: $341 million from operations, $47 million from tax efficiency. This decomposition proved valuable during the investment committee discussion, as it clarified that returns depended primarily on operational improvement rather than financial engineering.
Key Insight: The WACC approach produced a $31 million range ($361M to $392M) depending on leverage assumptions—an 8% variance that could swing the investment decision. APV eliminated this ambiguity by treating changing leverage explicitly rather than forcing a single assumption.
05 Software Tools and Implementation Efficiency
While APV offers theoretical and practical advantages in the scenarios outlined above, implementation complexity has historically limited adoption. Building flexible APV models in Excel requires careful attention to circular references (since debt levels depend on enterprise value, which depends on tax shields, which depend on debt levels), proper discount rate application across varying time periods, and robust scenario analysis capabilities.
Modern valuation platforms have reduced this friction considerably. Professional-grade tools now automate the technical mechanics—calculating unlevered costs of equity, modeling complex debt schedules, applying Miles-Ezzell adjustments, and reconciling APV and WACC approaches for validation purposes. This automation allows practitioners to focus on judgment-intensive inputs (growth rates, margin assumptions, exit multiples) rather than formula mechanics.
For advisory firms conducting multiple valuations monthly, the efficiency gains are substantial. A mid-sized M&A advisory firm reported that adopting systematic APV capabilities reduced modeling time for LBO valuations by approximately 35% while improving consistency across deal teams. The ability to quickly toggle between APV and WACC approaches also proved valuable in client discussions, as different audiences sometimes prefer different frameworks.
06 Looking Forward: APV in an Evolving Capital Markets Environment
Several trends in 2025-2026 capital markets suggest APV methodology will grow increasingly relevant:
Rising Interest Rates and Debt Costs: With base rates elevated compared to the 2010-2021 period, the magnitude of tax shields has increased materially. A company with $200 million in debt paying 8.5% interest generates $3.6 million in annual tax shields (at 21% rate), compared to $2.1 million when debt cost 5%. Larger tax shields make precise valuation of these benefits more important, favoring APV's explicit treatment.
Complex Earnout Structures: Earnouts have become standard in middle-market M&A, appearing in approximately 42% of transactions in 2024 versus 28% in 2019. These contingent payments create time-varying capital structures that WACC handles poorly. APV can model the expected earnout payment schedule and associated financing effects more naturally.
ESG-Linked Financing: Sustainability-linked loans with interest rates tied to ESG metrics introduce another dimension of complexity. A company might pay L+400 if it meets carbon reduction targets, or L+450 if it doesn't. This creates state-dependent tax shields that APV can model explicitly through scenario analysis.
Private Credit Growth: The private credit market has expanded dramatically, with direct lenders often providing customized, complex financing structures including delayed draw term loans, accordion features, and performance-based pricing. These structures resist simple WACC treatment but fit naturally into APV frameworks.
07 Conclusion: Choosing the Right Tool for the Valuation Task
The choice between APV and WACC is not binary—both methods have appropriate applications. For stable companies with relatively constant capital structures, mature industries, and straightforward financing, WACC offers simplicity and familiarity. The method works well for public company valuations where market-based costs of capital are readily observable and capital structure changes occur gradually.
But for the increasingly common scenarios involving significant leverage changes, complex financing structures, cross-border tax considerations, or financial distress, APV delivers materially superior accuracy. The method's transparency—explicitly separating operating value from financing effects—also provides valuable insights for investment committees, boards, and transaction negotiations.
The technical barriers that once limited APV adoption have largely dissolved. Practitioners comfortable with DCF mechanics can master APV implementation with modest additional effort, particularly when supported by modern analytical tools. Platforms like iValuate have democratized sophisticated valuation techniques, making APV analysis accessible to middle-market advisors and corporate development teams, not just bulge-bracket investment banks.
As capital structures grow more complex and stakeholders demand greater transparency in valuation assumptions, the explicit, component-based approach of APV positions it as an increasingly essential tool in the professional valuator's toolkit. The question is no longer whether to learn APV methodology, but rather how quickly practitioners can incorporate it into their standard analytical frameworks. For those who do, the payoff comes in more accurate valuations, better-informed investment decisions, and enhanced credibility with sophisticated clients and counterparties who recognize the method's technical superiority in the right contexts.